Logs#
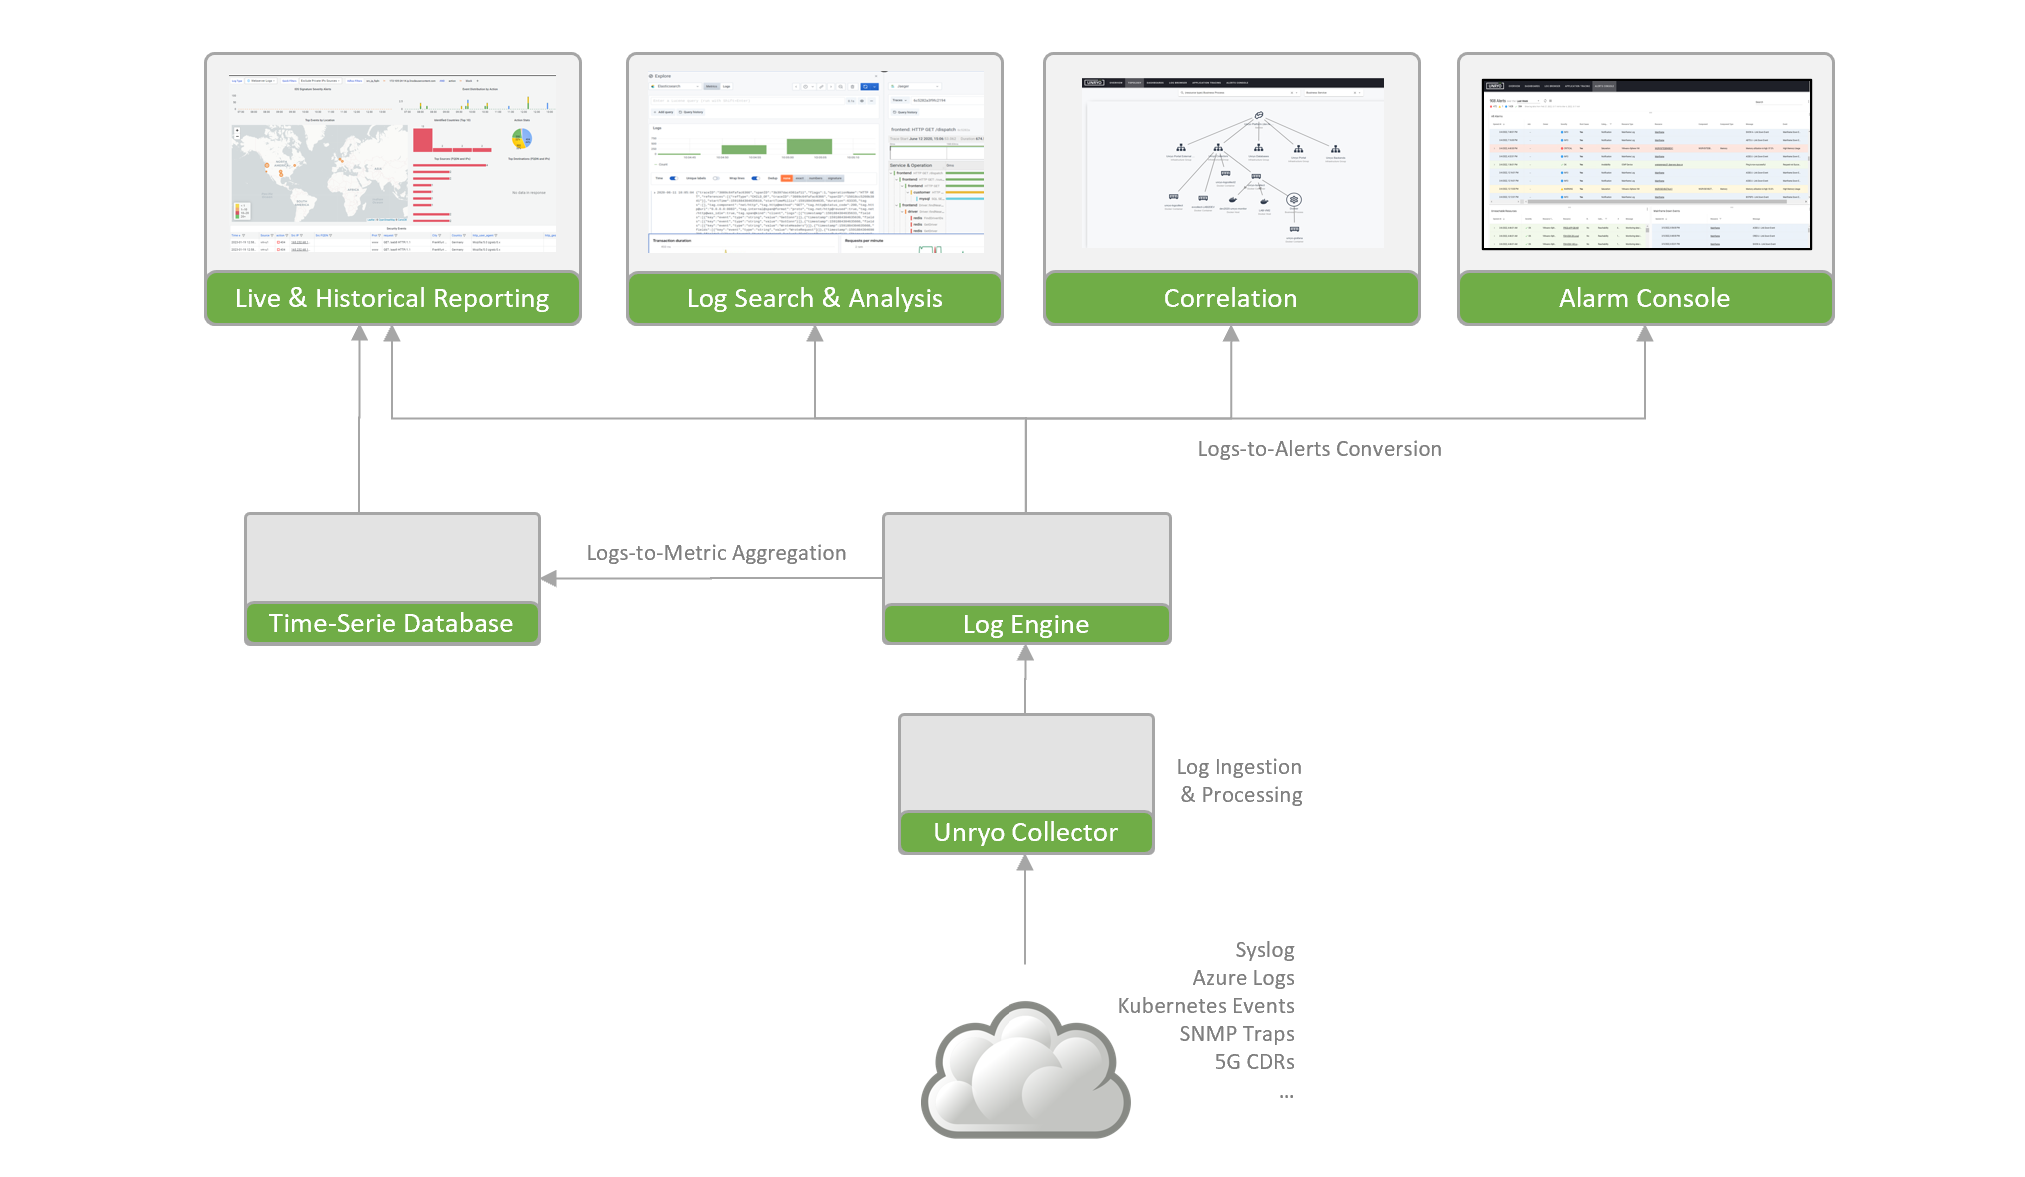
Unryo accepts virtually any type of logs and events into a horizontally-scalable architecture, allowing you to ingest massive volumes of log data and bring more visibility into your servers, containers, applications, network and cloud services.
The Unryo platform integrates Fluentd for log shipping and OpenSearch for the backend.
Sizing Recommendations#
The collector (logging agent module) needs a minimum of 250 MB, but we recommended to use 1GB. For example, at a rate of 100 1-KB-sized log entries per second, the logging agent with default configurations consumes 5% CPU on one core and 150MB of memory.
If you need a high-ingestion logging system, we recommend to have multiple Unryo collectors, with each node being responsible for one thing, following the Unix way.
Get Logs In#
| Template | Description |
|---|---|
| Azure Alert Webhook | Receive and parse alerts from Azure |
| Azure Event Hub | Receive and parse logs from Azure Event Hub |
| Cisco FirePower Firewall | Receive and parse logs from Cisco FirePower Firewall |
| Docker Logs | Receive logs from Docker containers |
| Exec | Parse output from an executable. |
| Forwarder | Receive logs from another node |
| HTTP | Receive logs from an HTTP endpoint |
| JSON | Receive logs from a file in JSON Format |
| Kubernetes Events | Receive and parse events from Kubernetes. |
| Netflow | Receive Netflow packets |
| Nginx | Receive Nginx logs from a file |
| PFSense Firewall | Parse output from PFSense Firewall. |
| Snort IDS | Parse output from Snort IDS. |
| Syslog | Receive Syslog logs from a server |
| TCP Stream | Receive logs from a TCP stream |
Process Logs#
| Template | Description |
|---|---|
| Log Filtering | Ignore logs by tags |
| Filter Tags | Match the tags you want |
| Forward to another node | Send logs to another node |
| Output to Azure Event Hub | Send logs to Azure Event Hub |
| Output to Kafka | Send logs to a Kafka receiver node. |
| Output to an S3 Bucket | Send logs to an S3 Bucket |
Explore Logs#
From the portal, users get visibility on logs in real-time and over time.
-
The Dashboard panel: to visualize logs in dashboards. Data is presented live (dashboards doing live queries on the log engine) and over a period of time (dashboards combine log queries and metrics aggregated from logs)
-
The Log Browser panel: to explore and inspect logs. Users can perform searches with simple keywords and use filters to narrow results.
Convert Logs into Metrics#
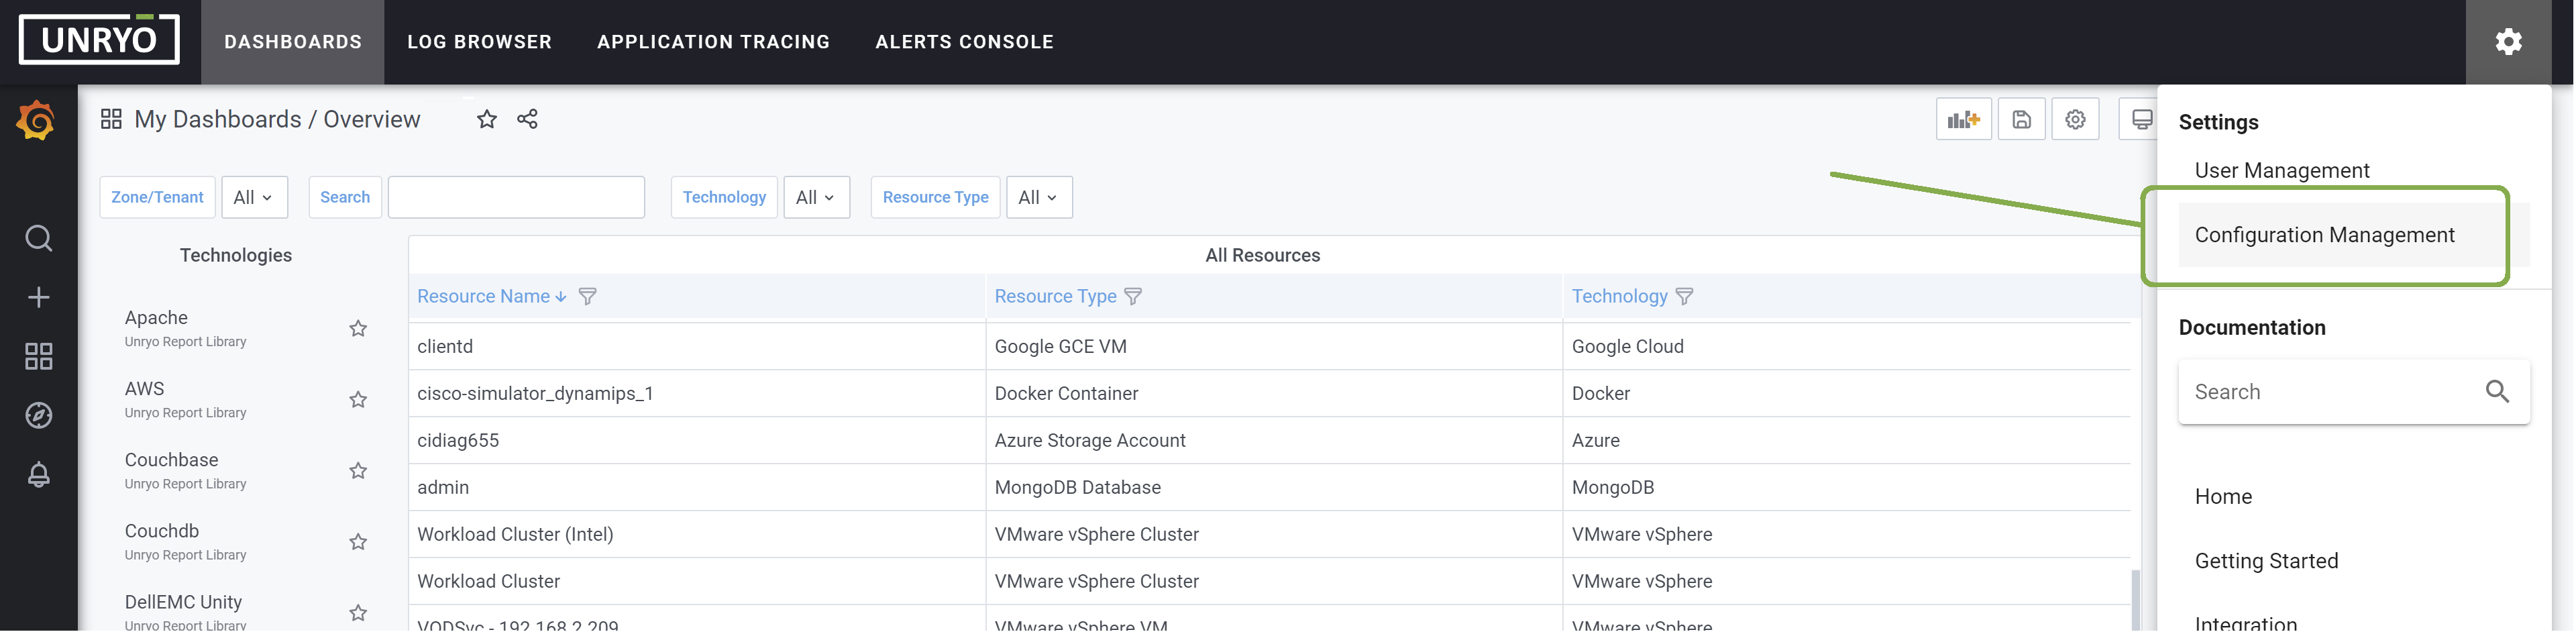
Go in Configuration Management.
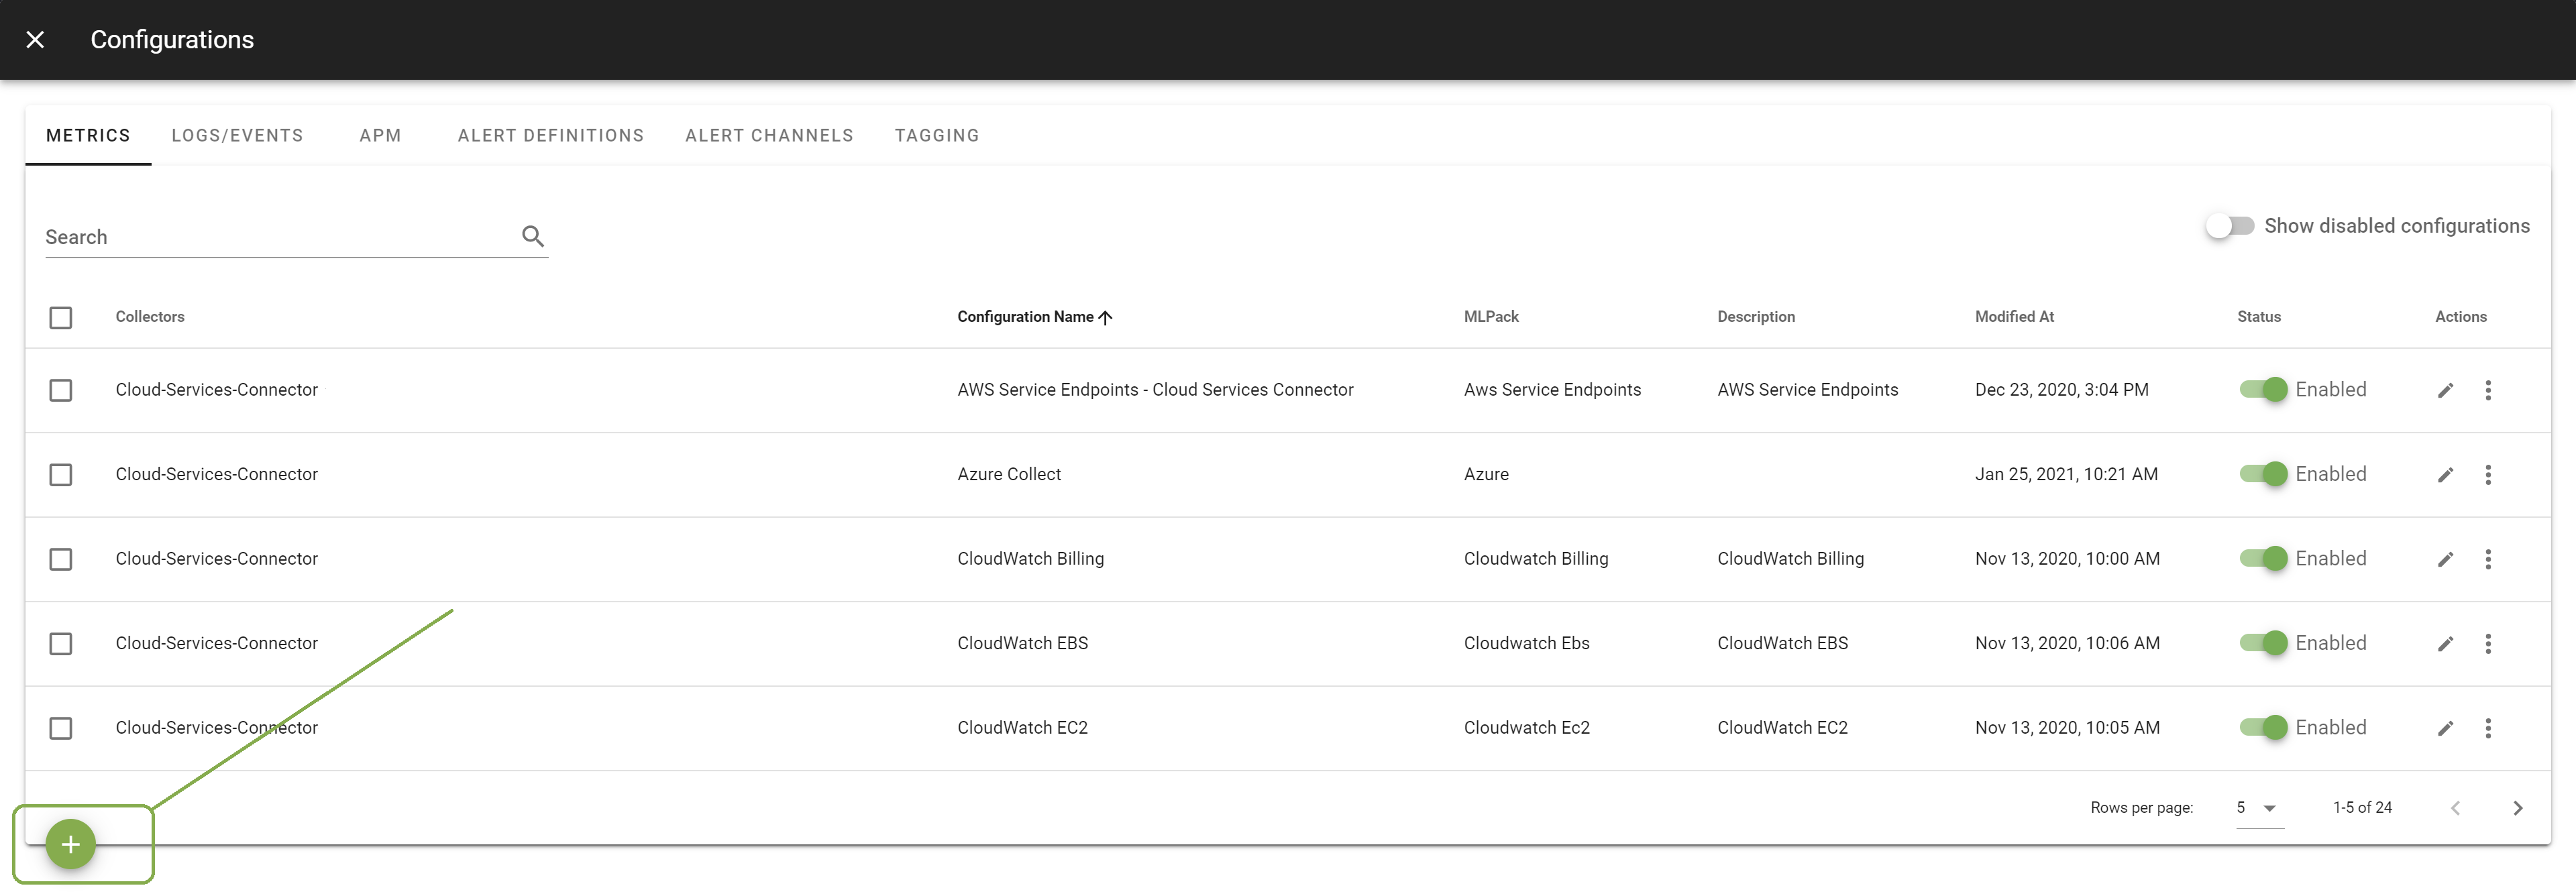
From the Metrics tab, click on the + button to add a new configuration.
Select the template Unryo Opensearch Query. Select the Collector on which you want this configuration to be deployed; and provide a Configuration Name that is meaningful for you. The Description is optional.
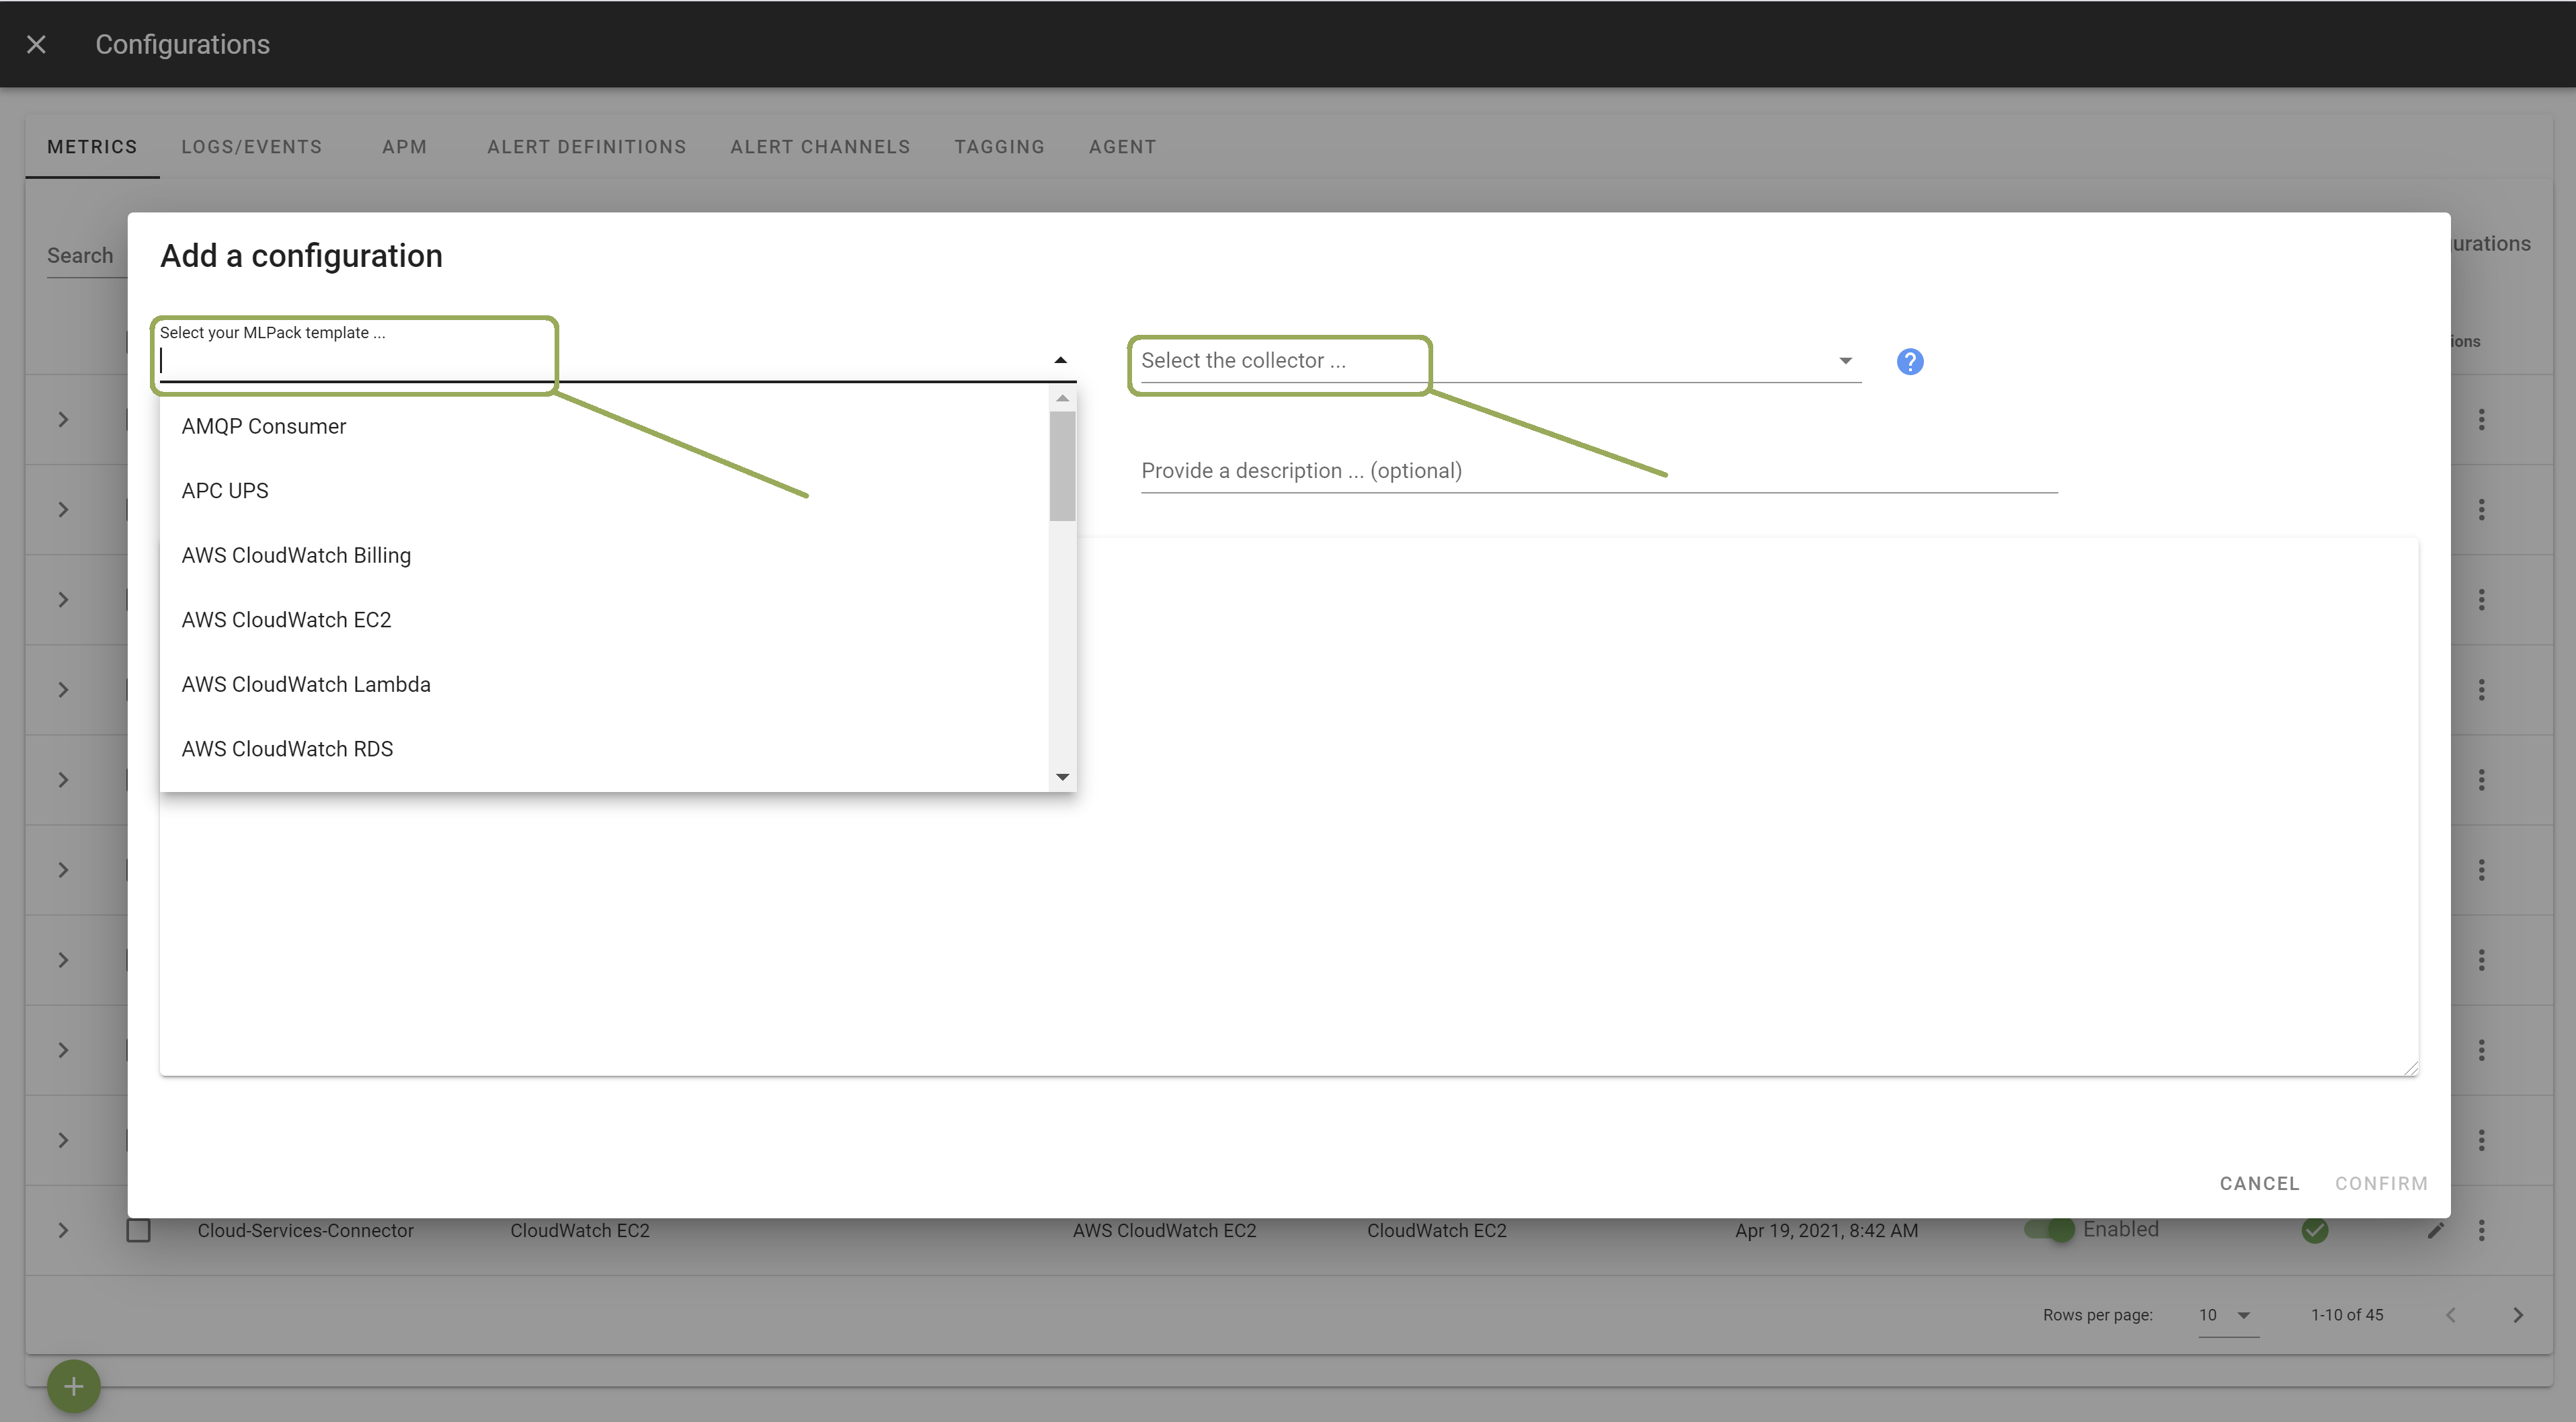
In the template, configure your log query. Other configuration options are possible. Browse the template to discover them.
Once done, click Apply.
Once done, matching logs will be stored as an aggregated metric.
Convert Logs into Alerts#
You can create alerts visually, based on a log pattern, a tag, an abnormal behavior, or even the lack of a log message. Unryo live-streams logs, create alerts visible in the alert console and can trigger immediate notifications.