Dashboards#
The Dashboard Panel#
The Dashboard panel presents the overall picture of your entire infrastructure, in real-time and over time. From there, users can drill-down to more specific information, for example, looking for a specific technology or device.
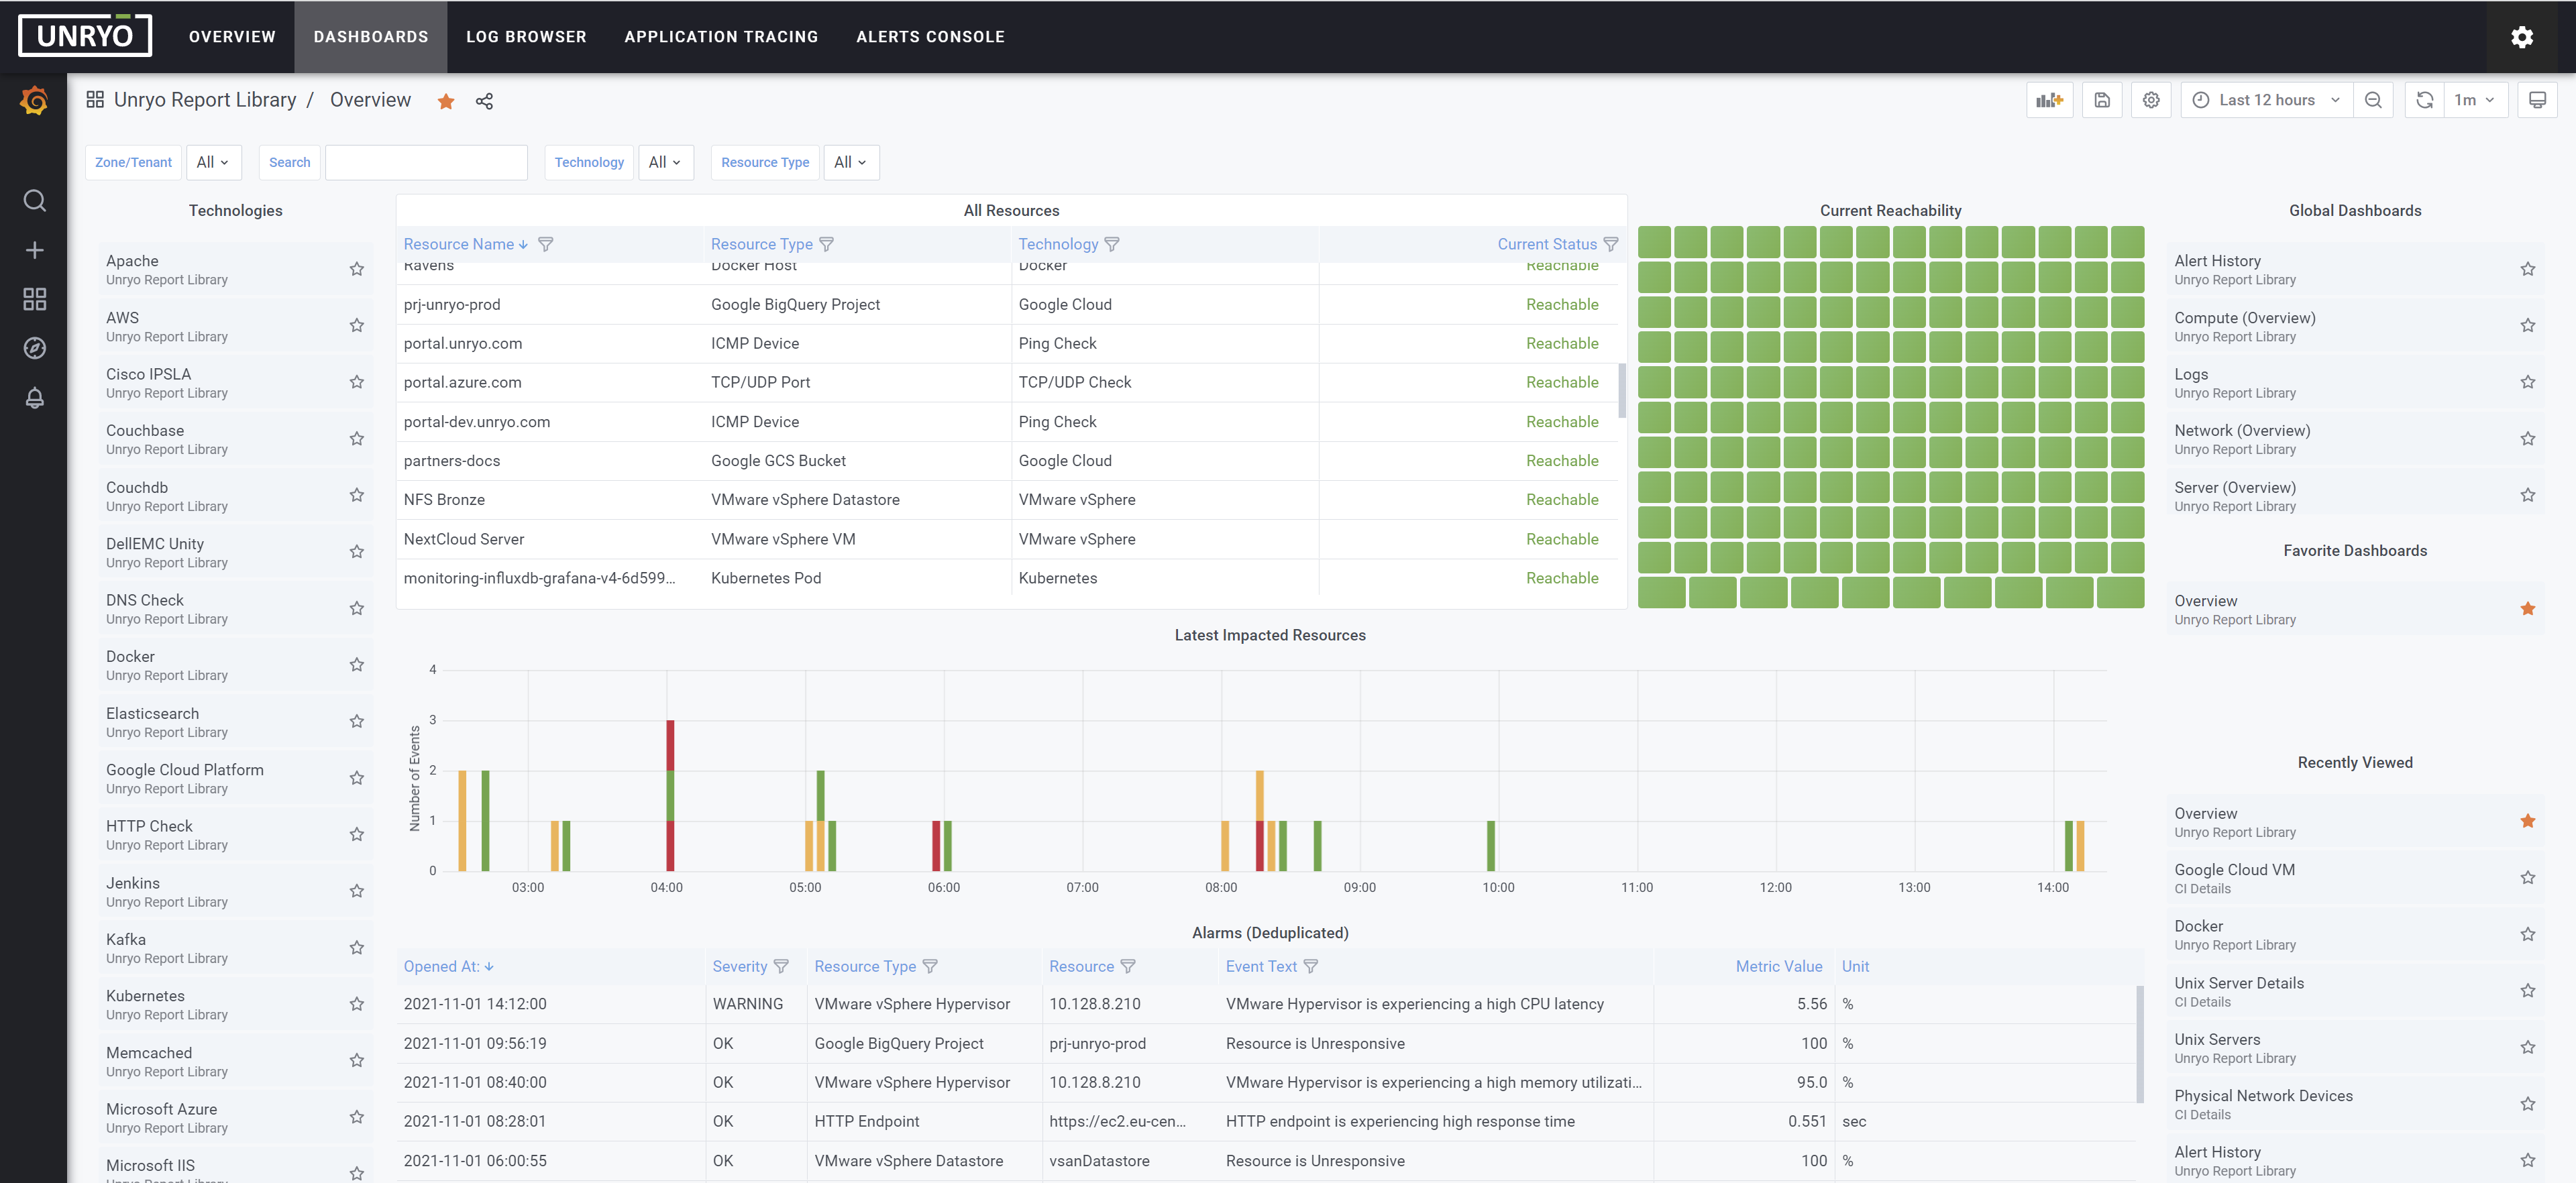
From there, users can:
- Browse dashboards and analyze deeper by selecting time ranges, etc.
- Share dashboards with colleagues or customers.
- Search Dashboards by name or tag.
- Add annotations on a graph, to mark points.
- Export data to CSV, Excel or PDF.
- Create their own dashboards specific to their needs.
- Import or Export dashboard templates.
Out-of-the-box dashboards#
Unryo comes with hundreds of dashboards, covering the most popular technologies and vendors across the full stack.
Out-of-the-box dashboards are read-only. They are updated periodically, along with the portal.
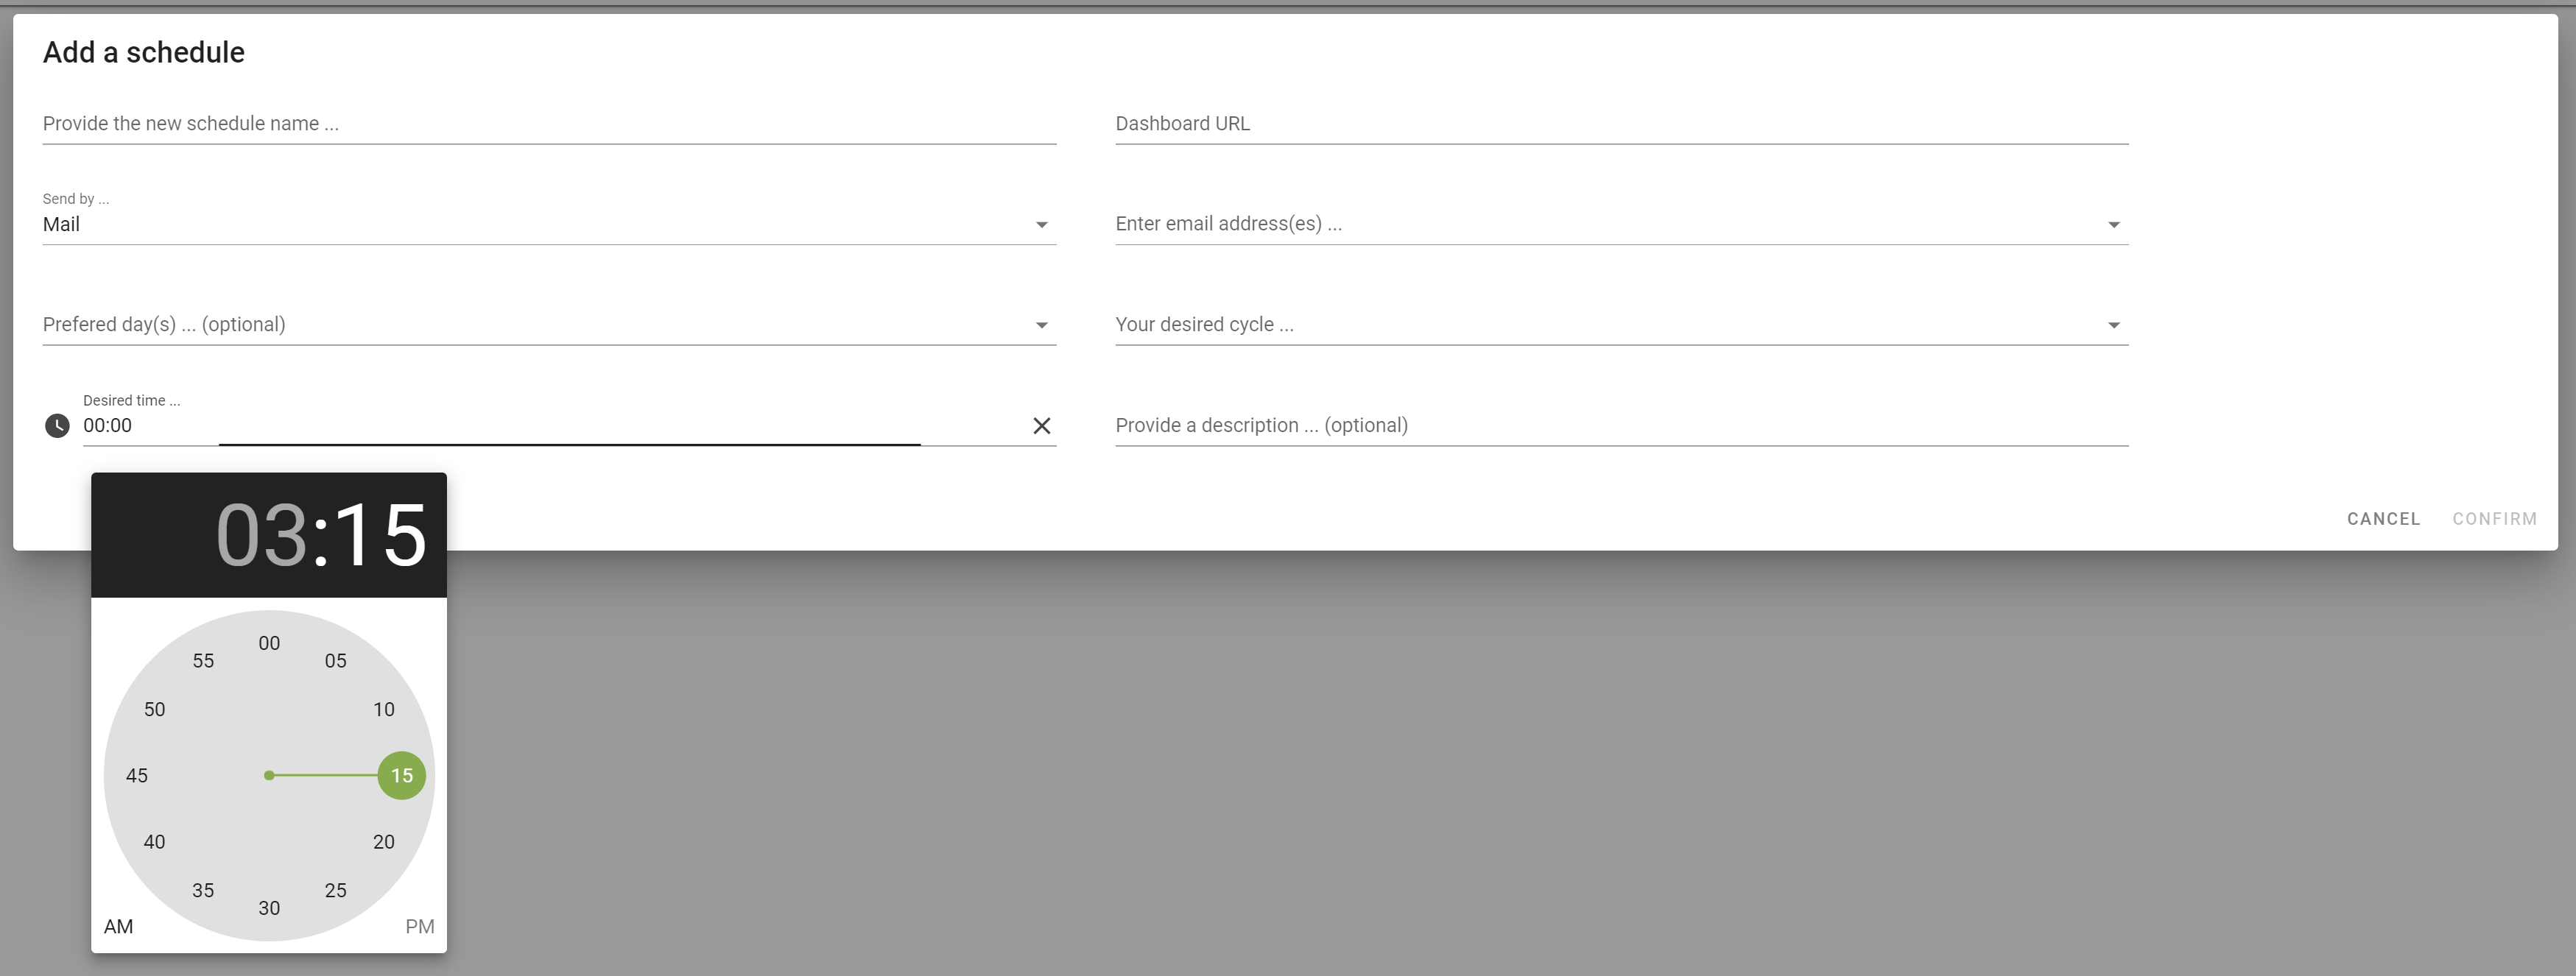
Schedule PDF Reports#
You can use the Schedule Reports to schedule the generation of dashboards in PDF format, and send them periodically to email recipients.
- From the top right gear, select
Schedule Reports - Click
+to add a schedule, then enter the parameters for that schedule. - Click
Confirm
If you want to test your new schedule, click Send Report Now icon, from the list of schedules.
For on premise deployments, you must specify the variable SMTP_ADDRESS in your docker-compose file:
x-portal-environment: &portalEnvironment
    <<: *commonEnvironment
    UNRYO_ADMIN_PASSWORD: ${ADMIN_PASSWORD}
    SMTP_ADDRESS: "<host>:<port>"