Setting up Alerts#
About Alerts#
Unryo comes with out-of-the-box, best-practice alert definitions for common devices and applications.
With those alert definitions, Unryo processes and analyzes millions of metrics and events within the stream of data, in order to detect anomalies in real-time.
Anomalies can be:
- performance issues, for example if your AWS VMs are in trouble, if your Kubernetes PODs are running out of memory.
- capacity issues, for example when a resource is soon to reach its capacity.
- errors, for example when an application returns an error code, or a network check fails.
- reachability issues, for example when a resource is detected down or unreachable.
- service degradation, for example when response times impact your users.
When an anomaly is detected, Unryo:
- performs root cause analysis (to determine the probable cause)
- calculate the impact magnitude (by identifying the impacted resources)
- create an alert, visible from the Alert Console, as well as displayed in context in dashboards and topology map.
- and (if specified) executes notification(s), such as email, SNMP trap, a Microsoft Teams message, or more.
Many alert definitions are enabled by default, so day one, you are informed on any potential problem.
Configure Alerts#
Alert definitions are managed centrally from the Configuration UI. In addition, you can also use the Unryo API to programmatically manage alert definitions.
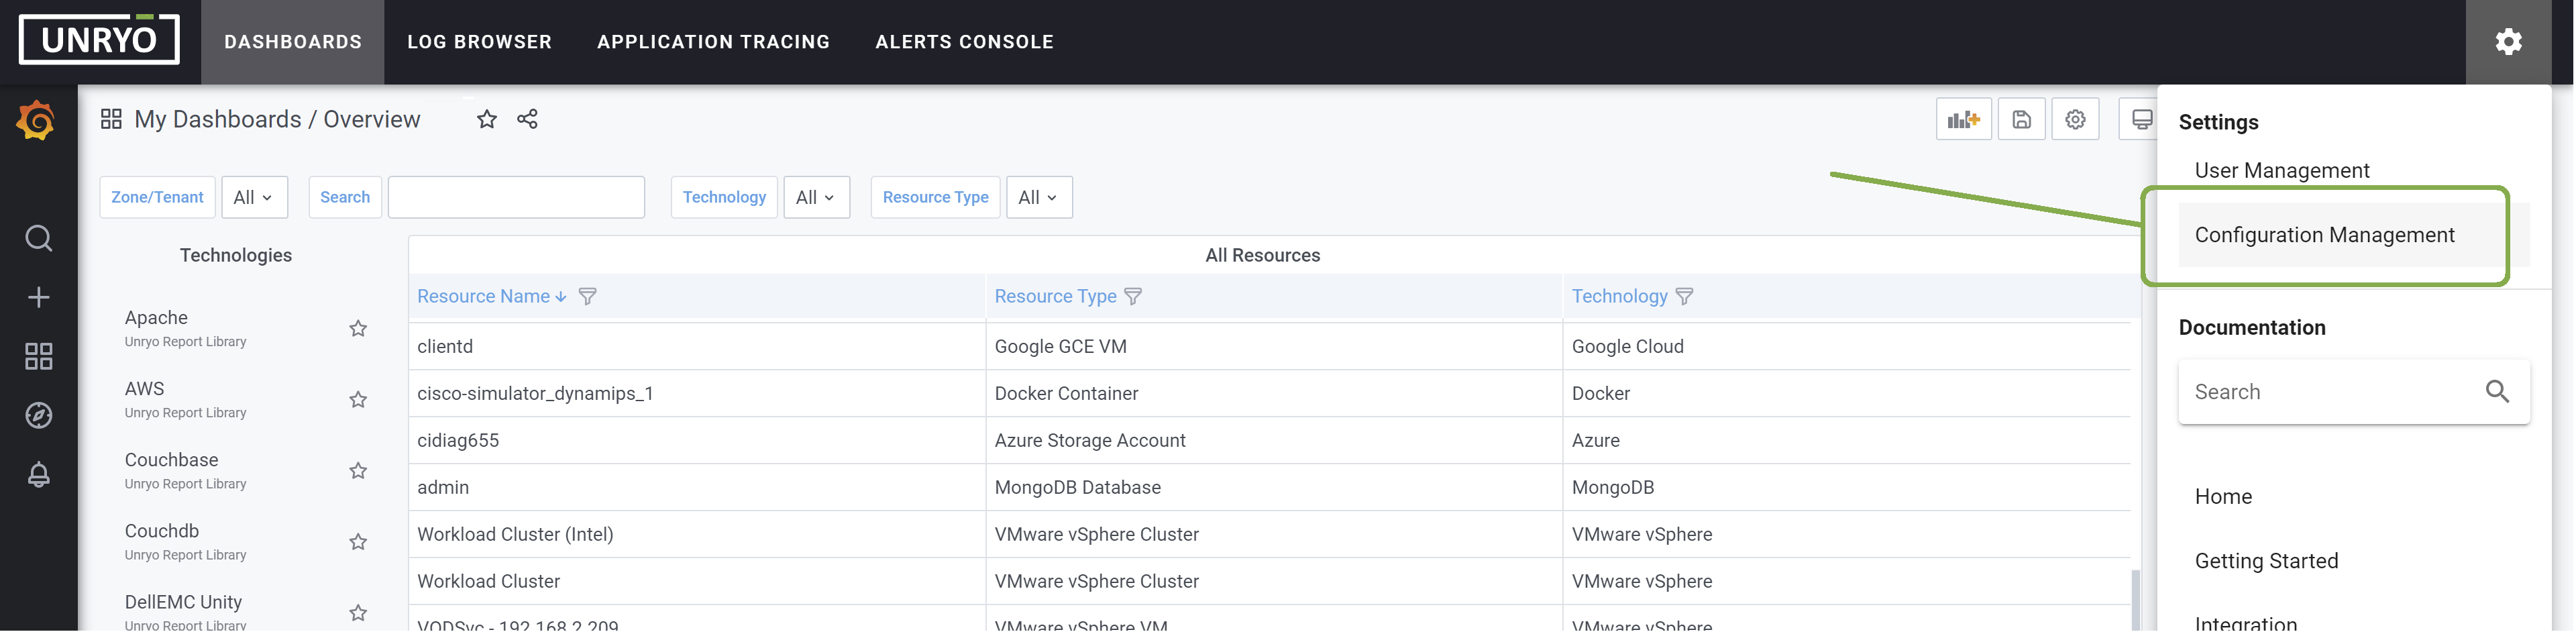
Go in Configuration Management.
Click on the Alert Definitions panel to list all the alert configurations. Tens of configurations are available and ready to use. They are instrumented with best-practice thresholds and settings to monitor a particular technology.
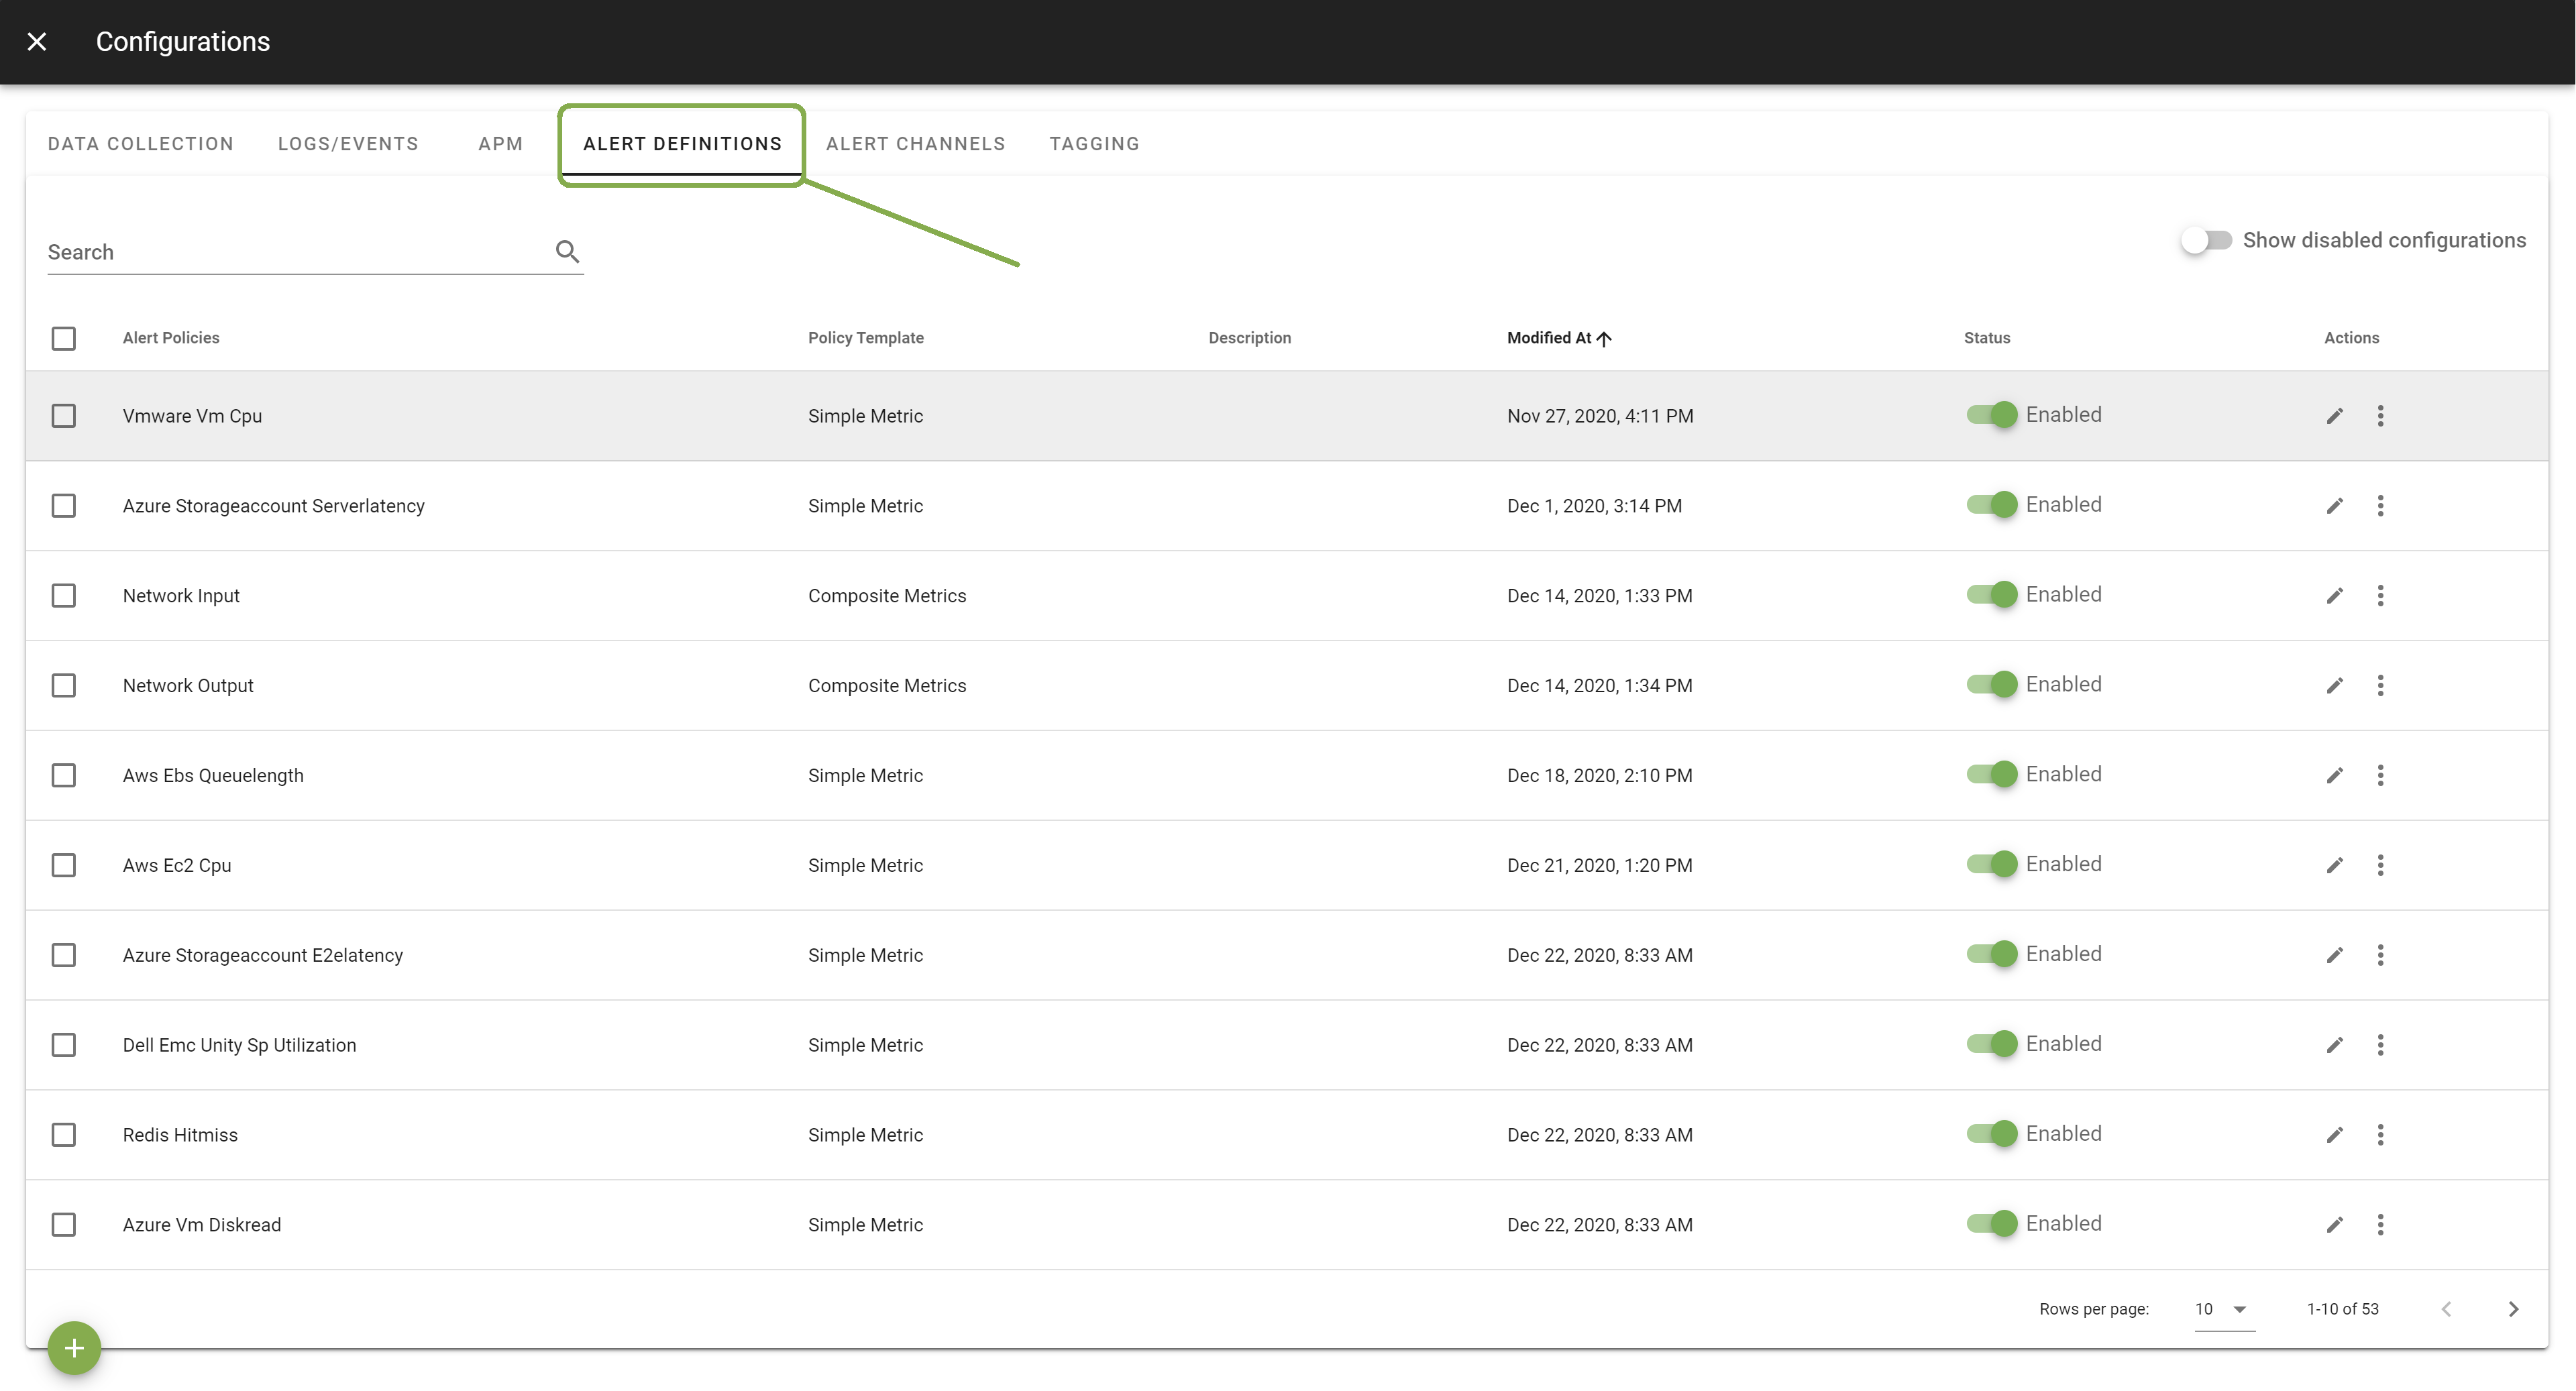
From there, you can:
Enable,Disable,DeleteandDuplicatean alert configuration.Editan alert configuration. You can change alert settings to your particular requirements. Typically, you may want to change thresholds, monitoring time windows, formulas, filter-out the stream of data to analyze (based on devices or any criteria), add a notification channel such as an email, Slack or other.Adda new configuration. Numerous alert templates are predefined to cover most common alerting needs.
Create your own Alert Configuration#
You add an alert definition by choosing a template to start from. Templates are designed to work out-of-the-box, by covering many analytics cases, such as simple threshold, forecast, deviation, no data detection or combo-metrics KPIs. You can use them as-is or adjust your thresholds and other settings.
Click + button to open the alert editor.
Select:
- the
alert templateyou want to use, - the
analytics engineon which you want this configuration to be deployed; - and provide a
Configuration Namethat is meaningful for you. - The
Descriptionis optional.
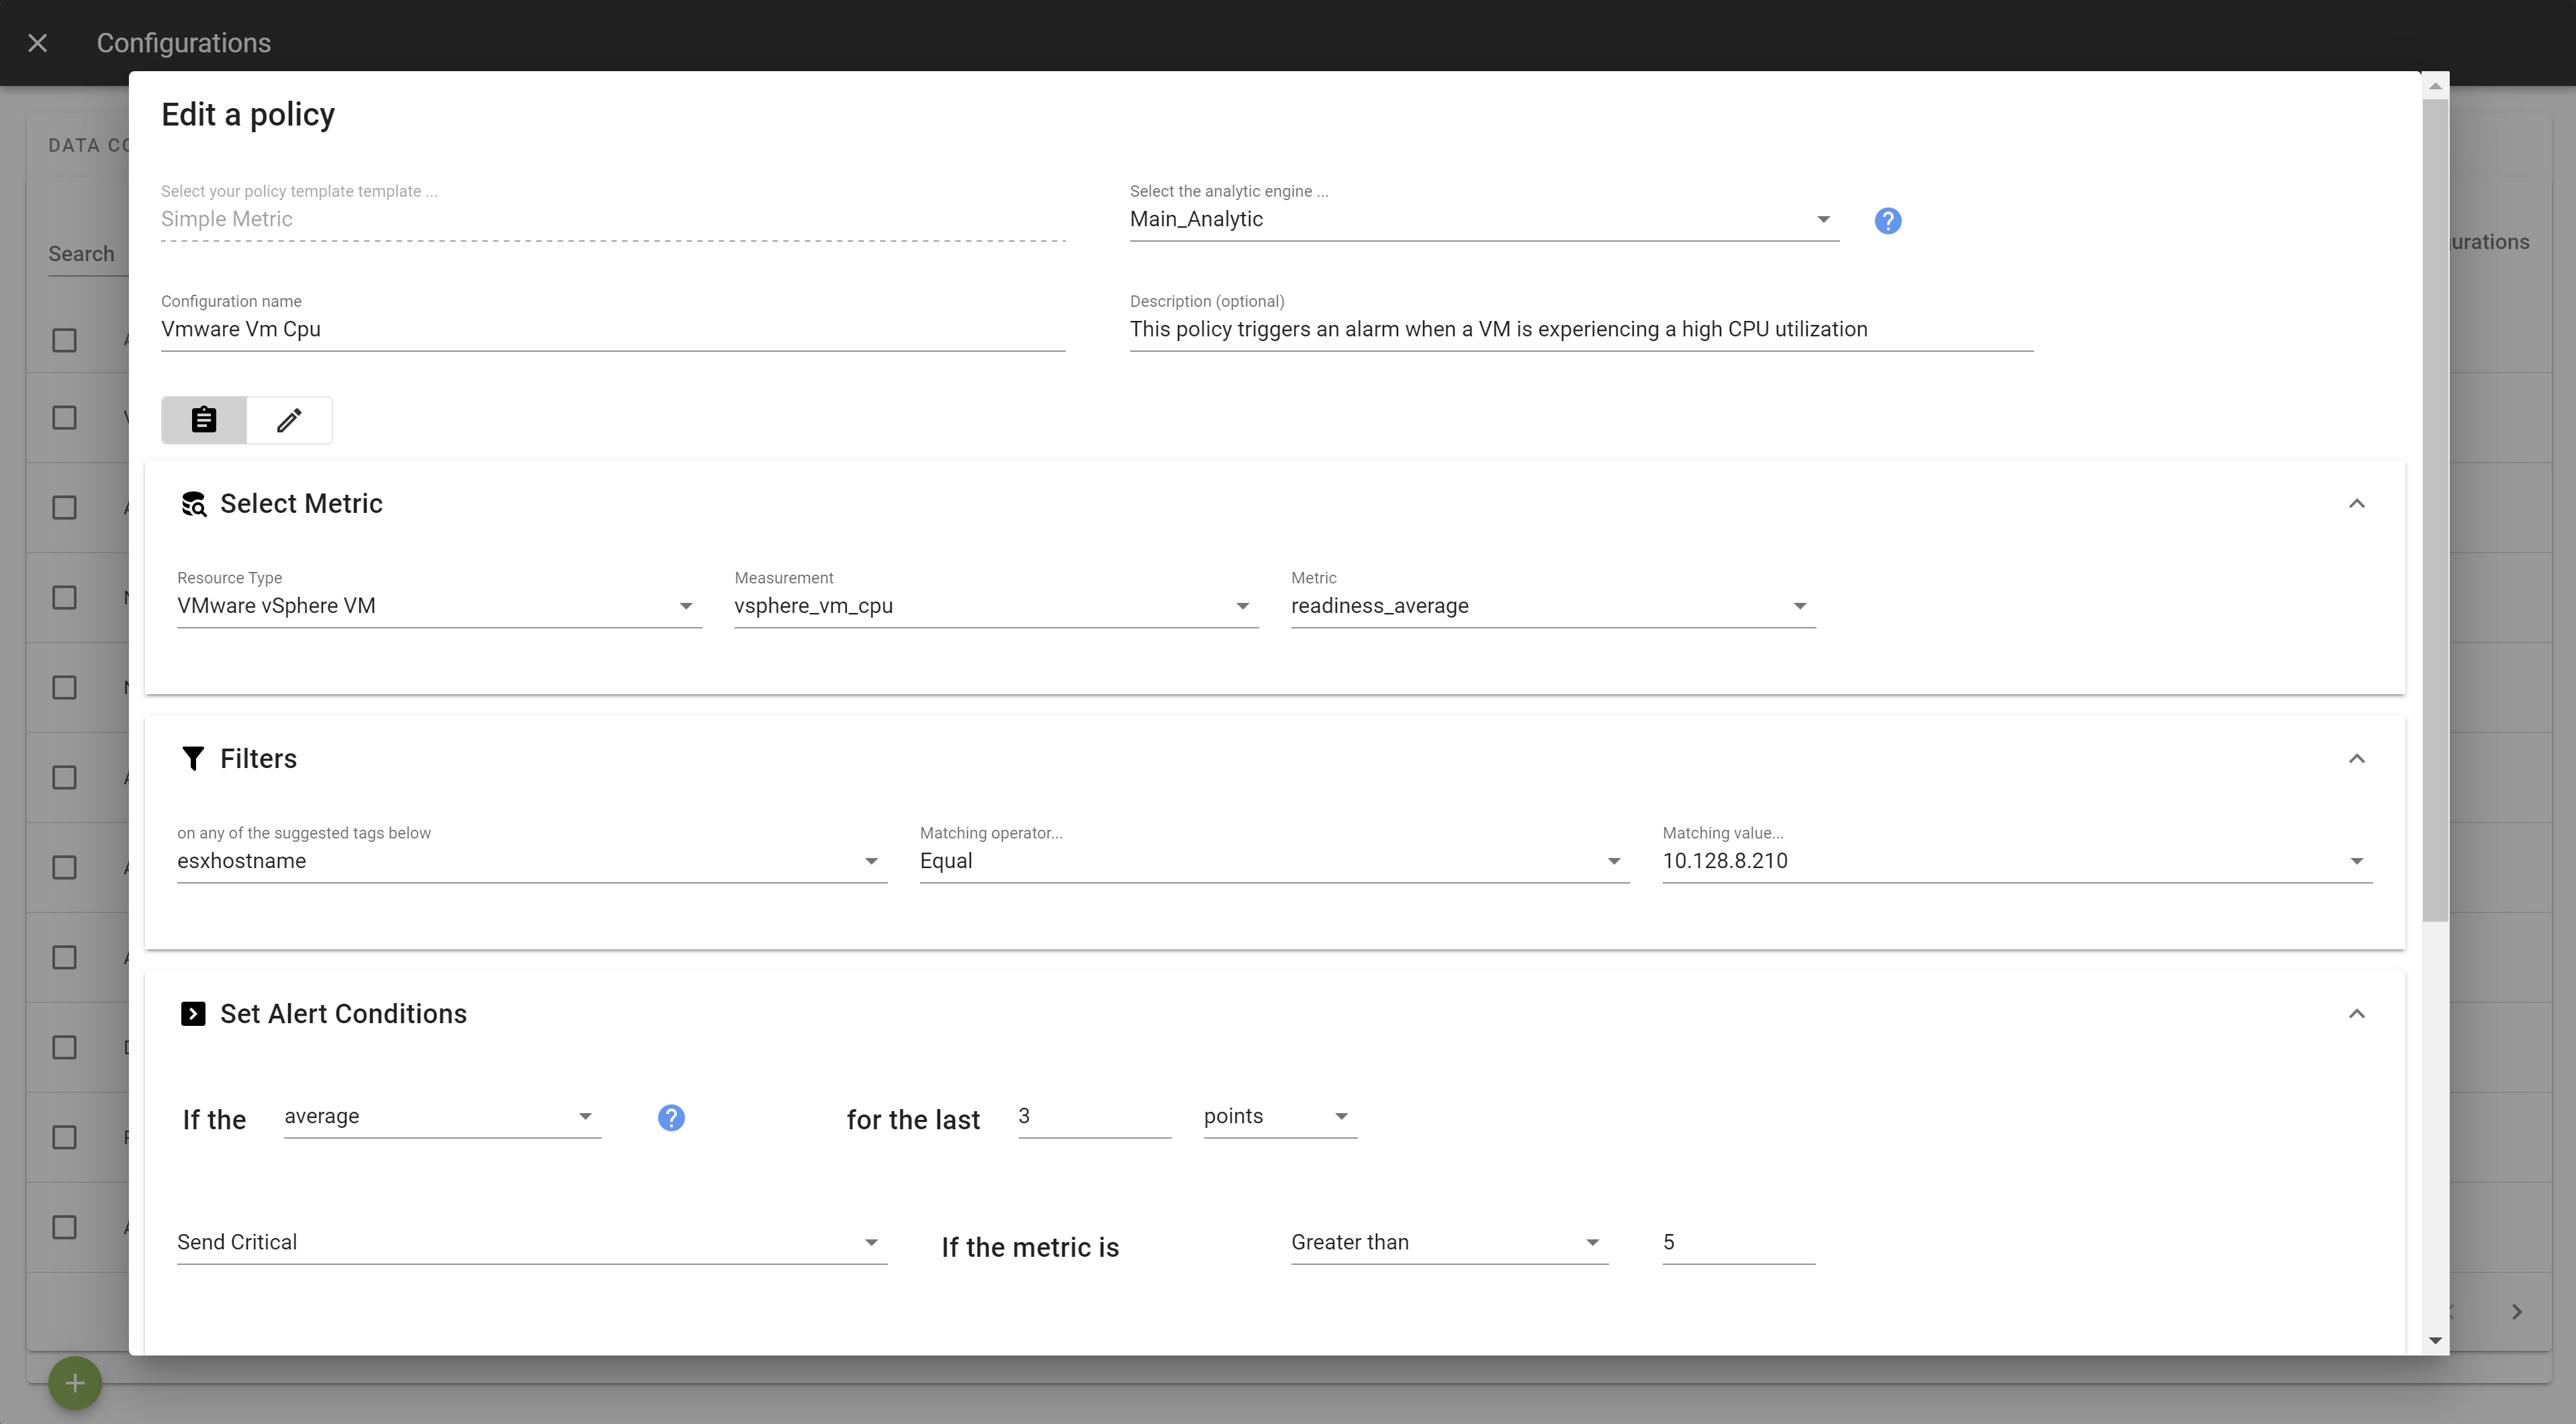
Define the alert definition as per your requirements, by specifying the stream of data to analyze, the alert conditions and which notifications to fire if any.
You can either use the
Alert UIor switch in edition mode to display the configuration file.
Once done, click Apply to save and then finally Enable the configuration to start the analysis.