Telegraf#
How it works#
- Your Telegraf(s) will send data to an Unryo Collector, which then routes it to the Unryo Platform.
- Automatically, Unryo will ingest data, analyze it and correlate it to find insights.
Unryo offers flexibility depending on your architecture. You can have all your Telegraf sending data to a central Unryo Collector. Or, if your environment is segmented (for example with distributed sites or multiple customers), you can consider using several Unryo Collectors.
Configuration#
Step 1: Configure Unryo to listen for telegraf data#
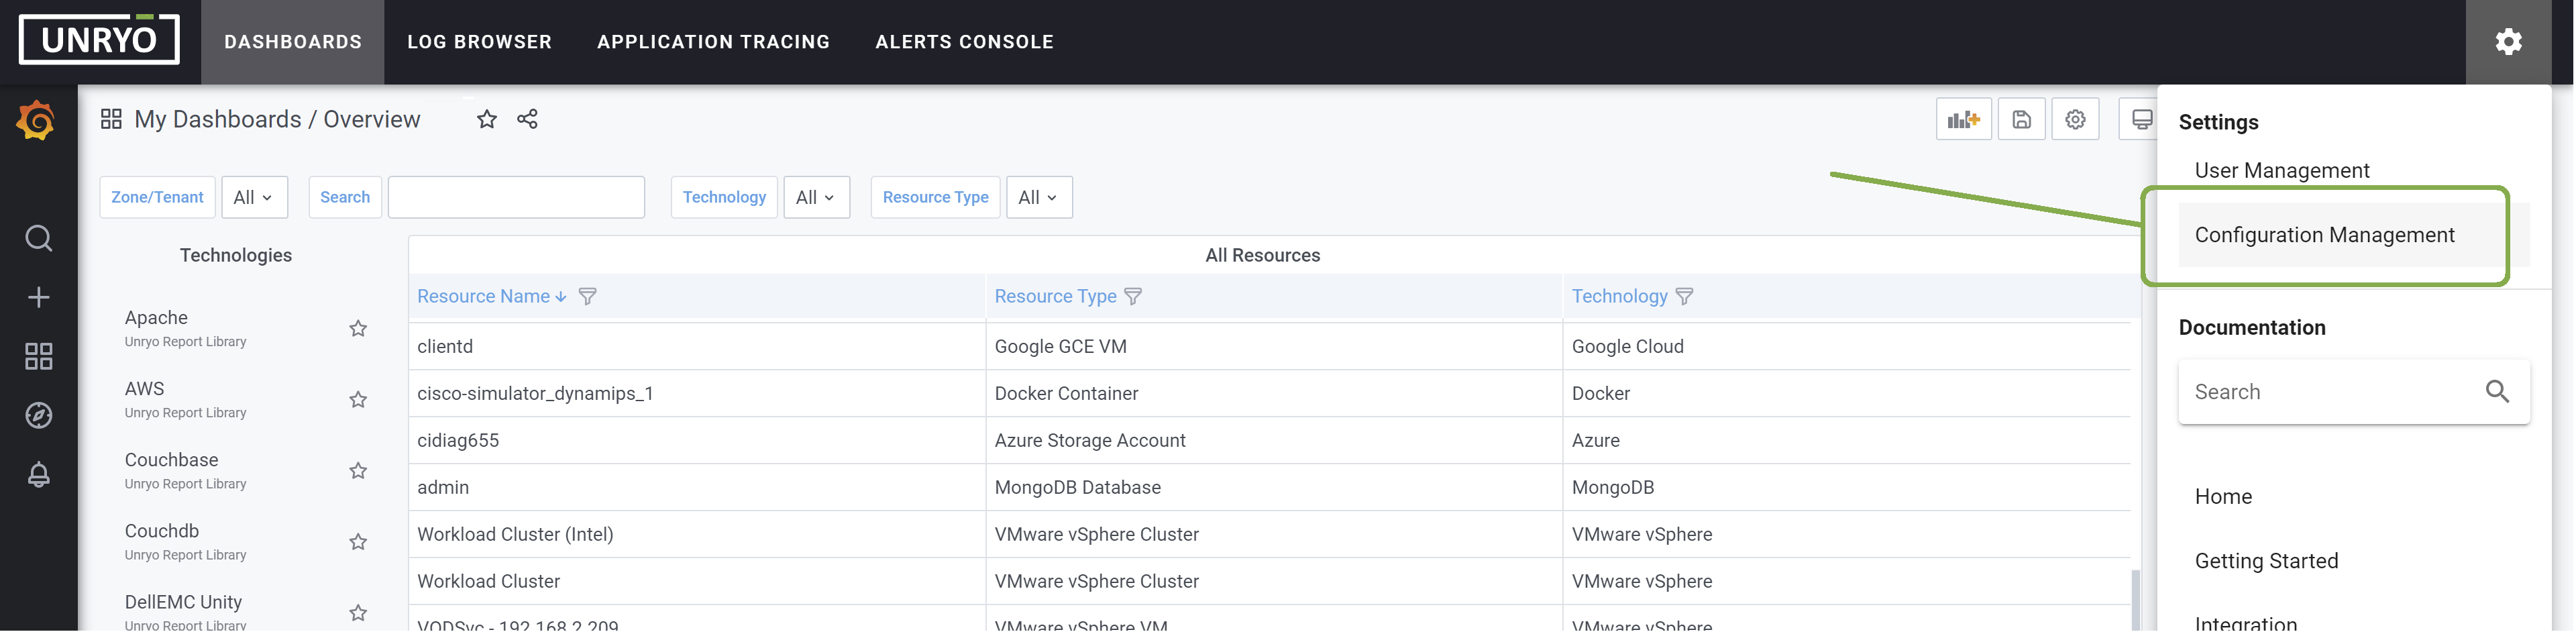
Go in Configuration Management.
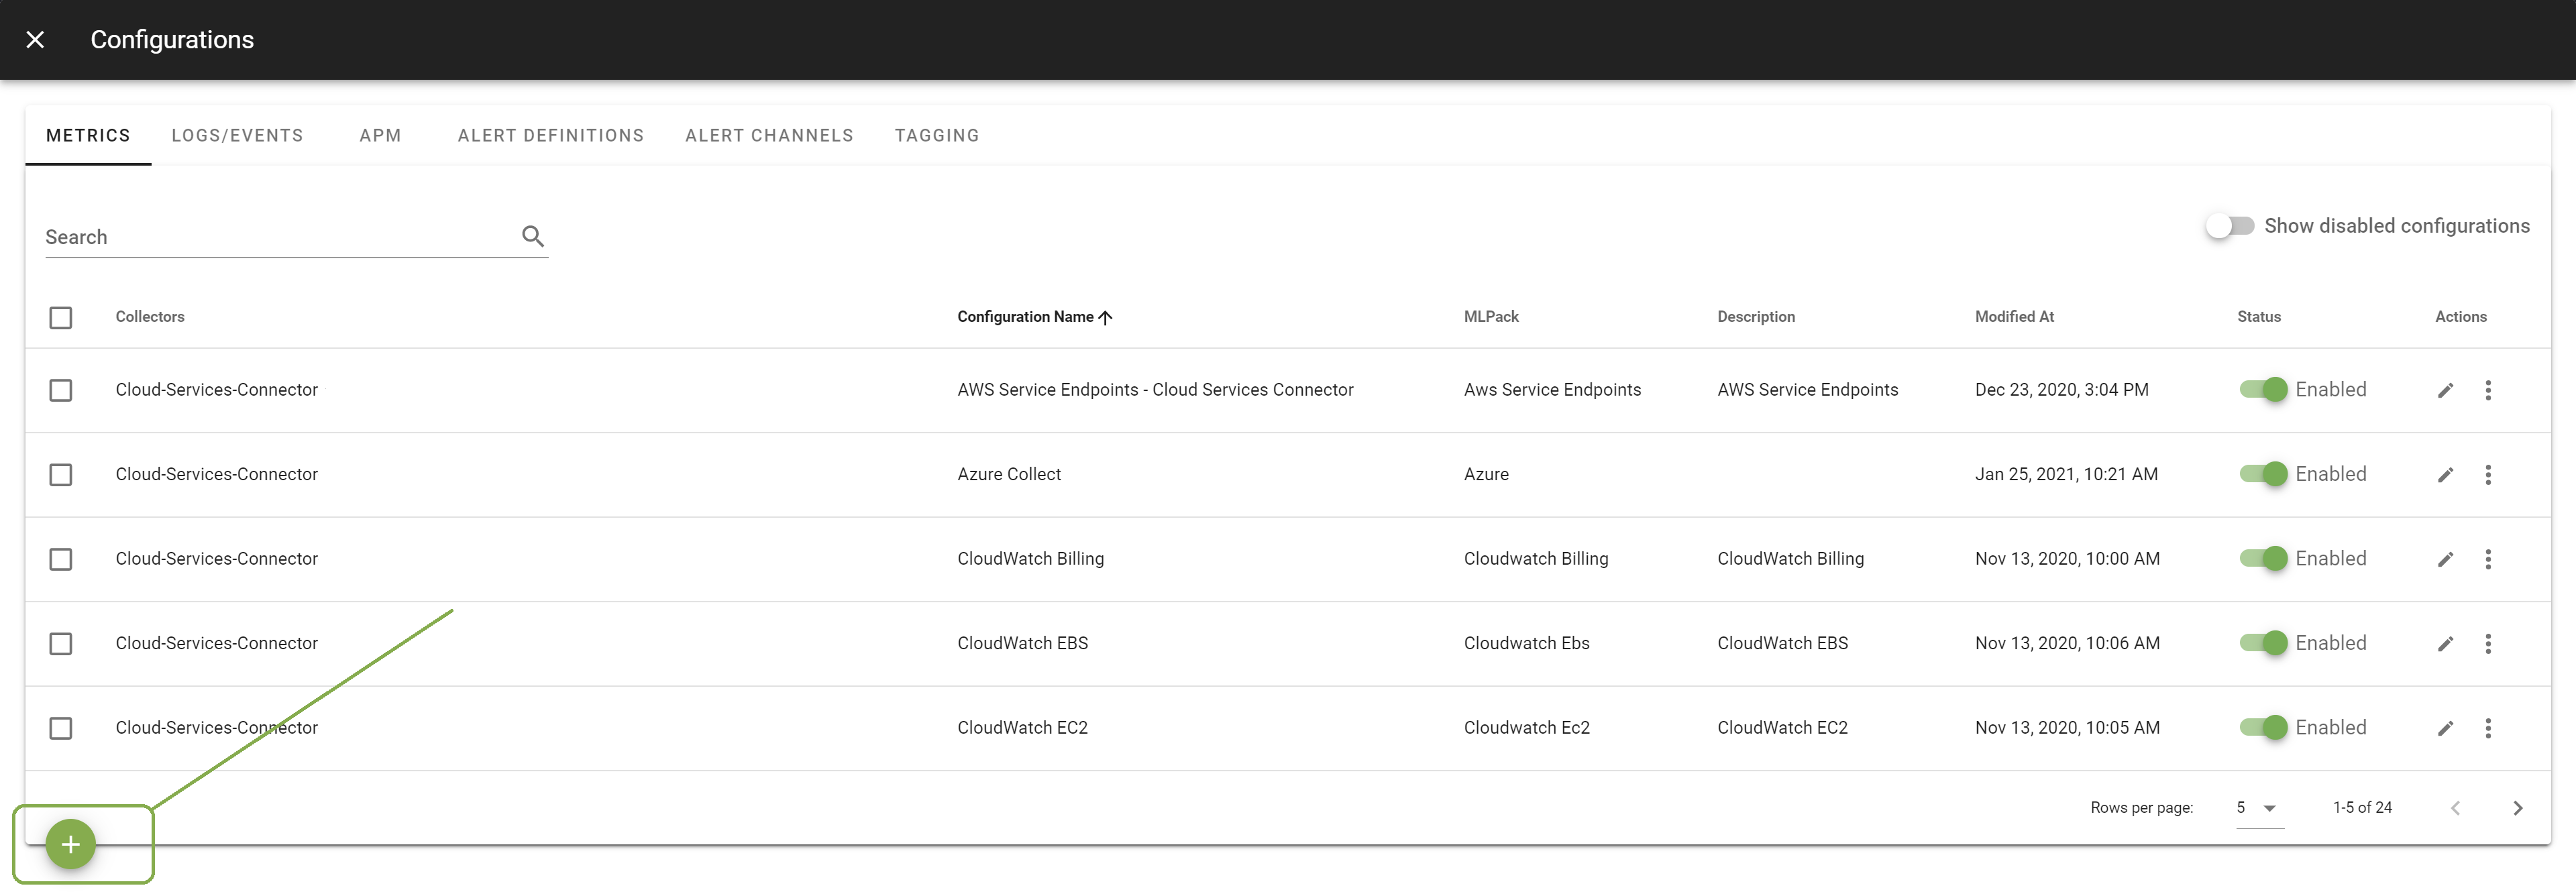
Click on the + button to add a new configuration.
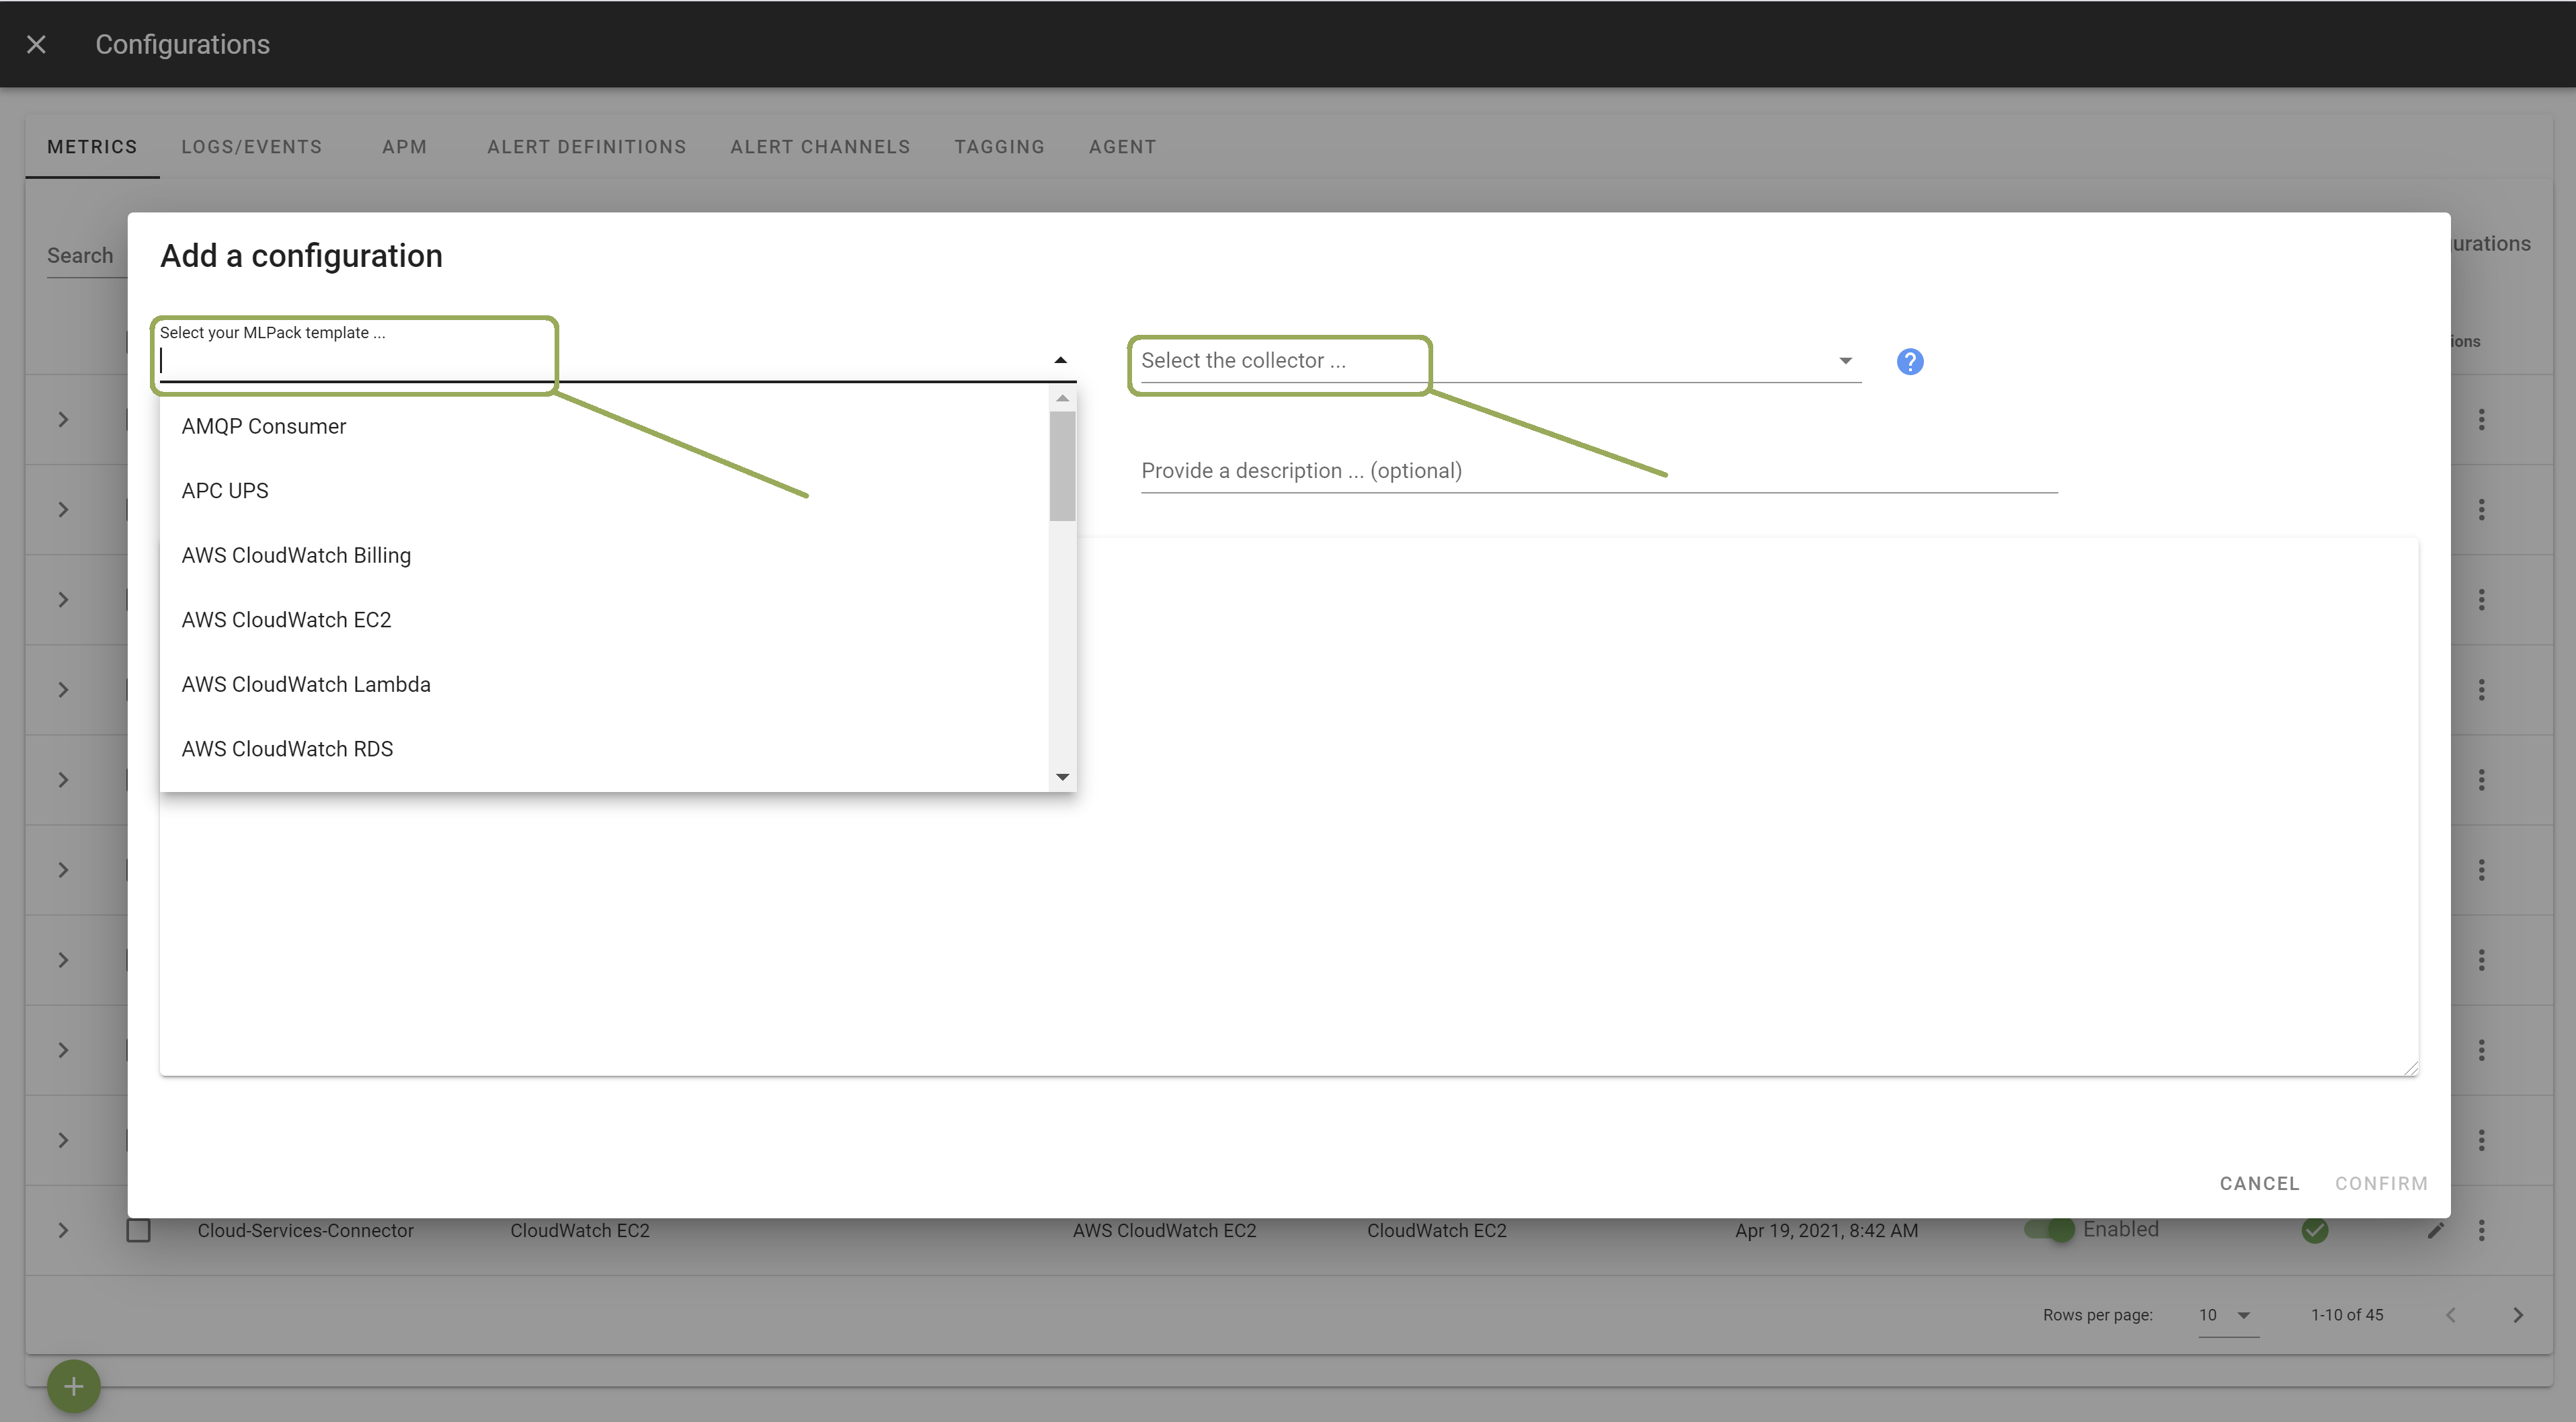
Select the template InfluxDB Listener. Select the Collector on which you want this configuration to be deployed; and provide a Configuration Name that is meaningful for you. The Description is optional.
The default contents will work fine. Only edit them if you know what you are doing.
Once done, click Apply. Your collector is now ready to accept data from your Telegraf(s).
Step 2: Indicate your Telegraf(s) where to send data#
In your Telegraf(s):
- configure the InfluxDB output plugin
- specify the Unryo collector address:
urls = ["<your Unryo collector address>"].
By default, Telegraf sends data to port 8186/tcp. Ensure all your Telegraf(s) can reach the Unryo Collector using this port (if need be, you can change to another port).
Start seeing insights!#
Unryo is now actively monitoring your telemetry information.
By default, all major Telegraf inputs are supported, meaning that Unryo understands the metric metadata, enrich them with context information, and knows how to modelize the topology and dependencies between resources.
You can start navigate the UI and see results of the correlation.