Install Unryo#
Cloud users: If you're using Unryo Cloud, skip this section and go directly to Collector installation.
What You'll Accomplish#
This guide walks you through installing the Unryo platform on your infrastructure using one of three methods:
- Docker Compose on a Linux server
- VMware vApp on vSphere
- Kubernetes with a Helm chart
Before you begin:
- Review the installation prerequisites.
- You’ll need an active Unryo account. If not, create one here.
Installation Prerequisites#
Download Links#
-
Docker Compose:
- Requires internet connectivity to pull images (or a private registry).
-
VMware vApp:
-
Kubernetes (Helm):
-
Unryo Agents (Linux/Windows hosts):
System Requirements#
Operating Systems
- Ubuntu 20.04 or 22.04 LTS (recommended)
- Red Hat Enterprise Linux (RHEL)
- Debian-based distributions
Additional requirements:
- Docker >= 24.x and Docker Compose >= 2.0 (for Docker deployment)
- VMware vSphere 6.7+ with vCenter (for vApp deployment)
Server Sizing#
| Network Size | All-In-One Platform | Collector Only |
|---|---|---|
| < 1,000 devices | 12GB RAM, 2 vCPUs, 60GB disk | 1.5GB RAM, 1 vCPU, 60GB disk |
| 1,000-10,000 devices | 16GB RAM, 4 vCPUs, 120GB disk | 2GB RAM, 2 vCPUs, 60GB disk |
| > 10,000 devices | Contact support for custom sizing | Contact support for custom sizing |
Network Requirements#
Unryo Platform (On-Premise)
| Port | Direction | Purpose |
|---|---|---|
| 443/tcp | Outbound | Registration & health checks (*.unryo.com) |
| 443/tcp | Inbound | Web portal & API access |
| 53/udp | Both | DNS resolution |
| 443/tcp | Outbound | LLM provider connectivity |
| 4224, 8086, 9200/tcp | Inbound | Data from remote collectors |
| 8186/tcp | Inbound | Data from Unryo agents |
- Configure outbound access for alert integrations (email, Slack, etc.)
- All connections use SSL encryption except DNS.
Unryo Collector
| Port | Direction | Purpose |
|---|---|---|
| 443/tcp | Outbound | Registration & health checks (*.unryo.com) |
| 53/udp | Both | DNS resolution |
| 8086/tcp | Outbound | Time-series data → platform |
| 9200/tcp | Outbound | Event data → platform |
| 4224/tcp | Outbound | Configuration management |
- Ensure collectors can also connect to your infrastructure and tools. See monitoring templates
Deployment Steps#
Log in to the Unryo Console.#

Create a new deployment#
- Click + Deployment → Start (deployments provide multi-tenant isolation to separate your environments)
- Select Trial → Next (license can be upgraded later)
- Enter a deployment name for later identification
- Open your deployment → Add Components
- Select All-in-one deployment → Private Infrastructure.
- Choose your deployment method: Docker, VMware vApp, or Kubernetes
Option A — Docker Compose#
- Copy the generated YAML into
docker-compose.ymlon your target host. - Start services:
cd /path/to/compose-file
docker-compose up -d
- If your file has a different name:
docker-compose -f <file>.yml up -d
Option B — VMware vApp#
-
Download the
.ovafile generated by the wizard. -
In vSphere Client:
-
Open a virtual machine and select the
.ovafile.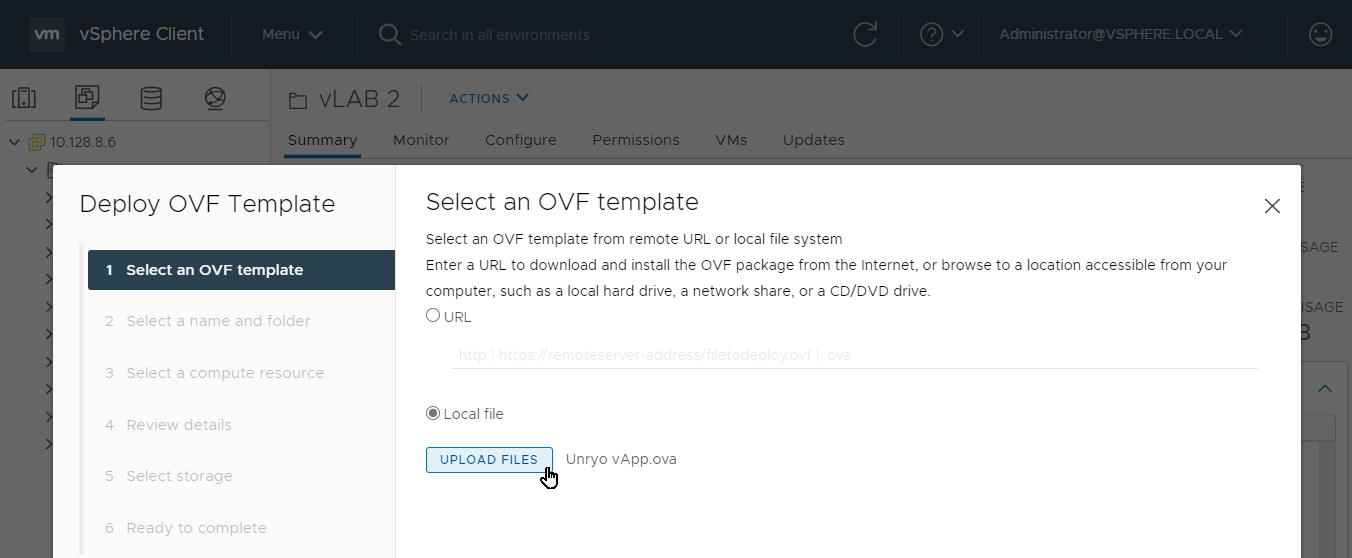
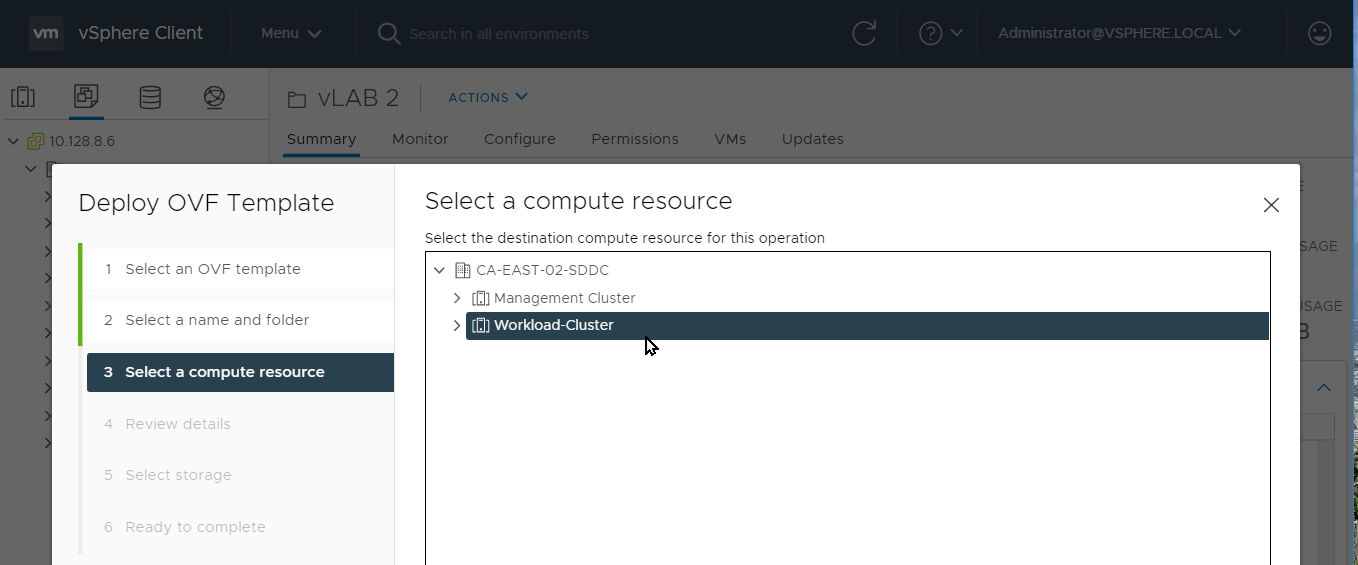
-
Select a compute resource (your vSphere application should have at least 8 GB RAM).
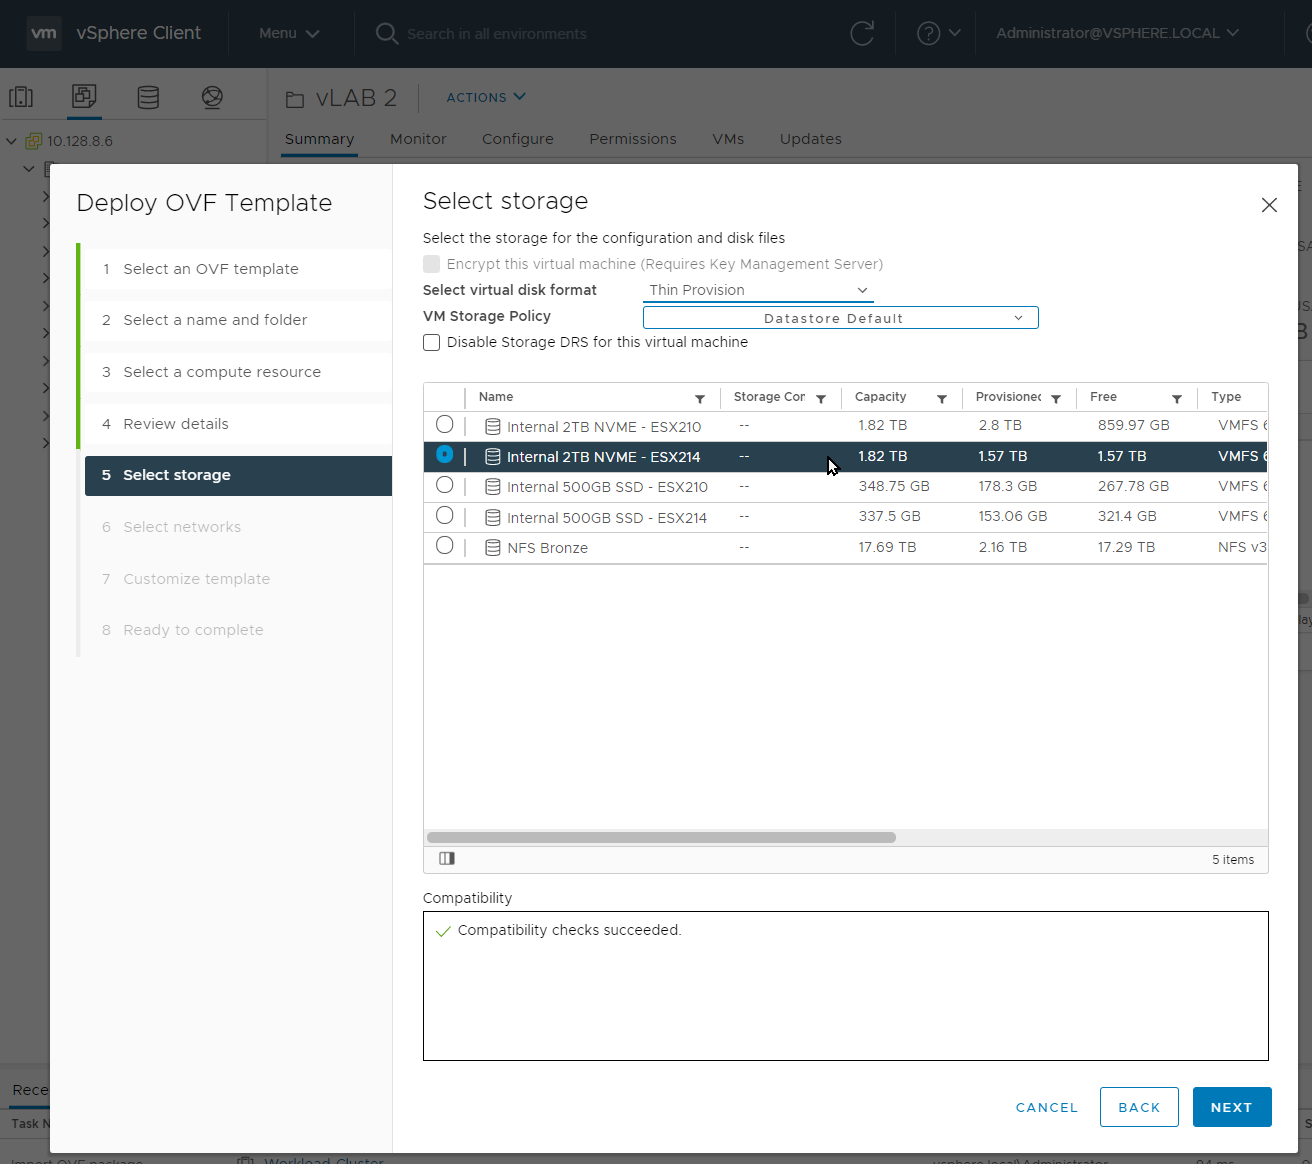
-
Select your storage (assign at least 50 GB storage)
-
Select your networks
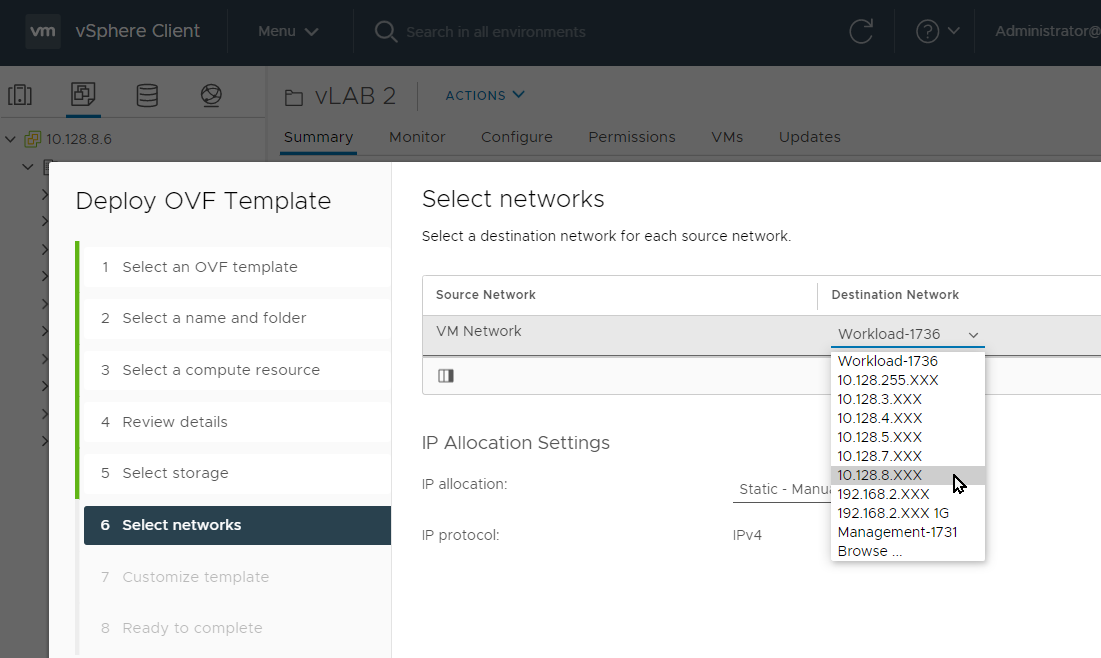
-
Custom vSphere Application
- Under the custom template network tab, all the fields are required (ensure the IP is free/unassigned)
- Under the Unryo tab, provide the token you received previously (from Unryo portal)
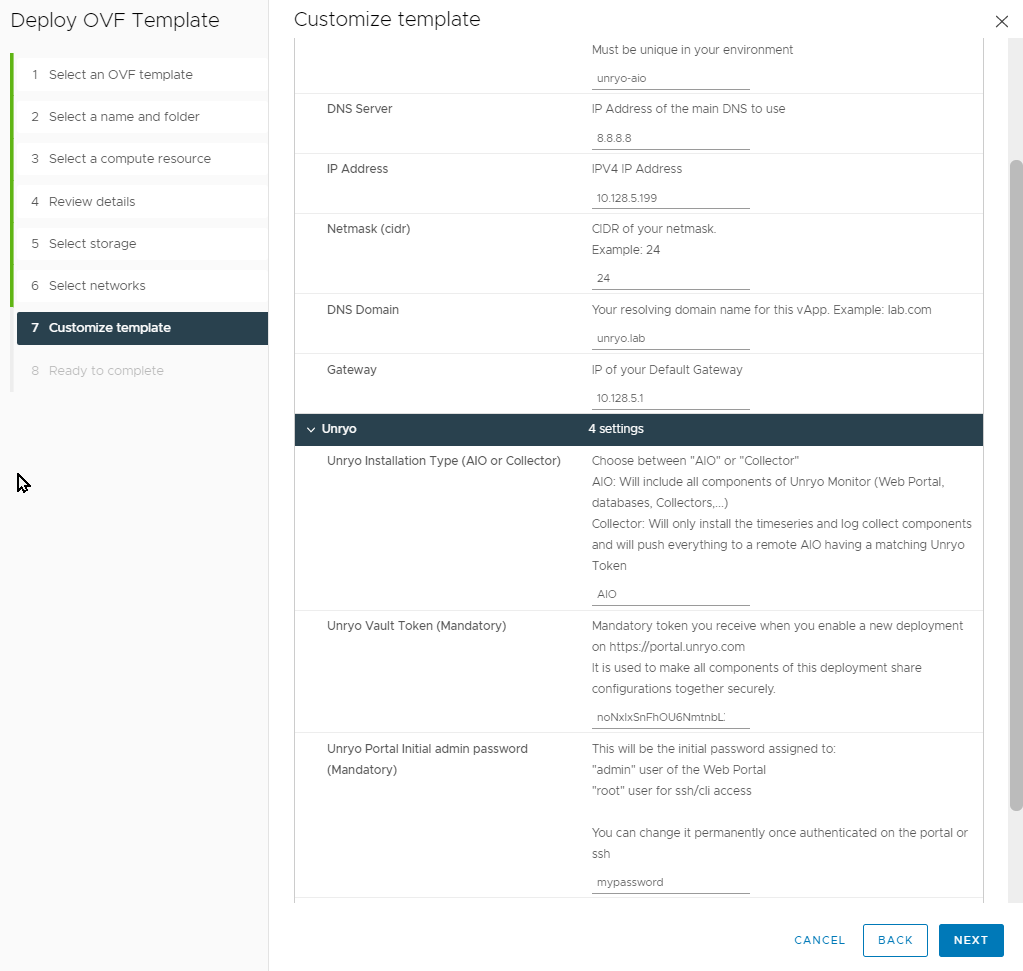
-
Click Next and wait a few minutes for components to boot and connect
-
Option C — Kubernetes#
Deploy the Unryo Helm chart following this procedure
Post-Deploy Checks#
- Default password is the same for root (CLI) and admin (web UI); update it later.
- Wait ~5 minutes after deployment for services to fully initialize.
- Check VM console or logs to confirm no failures.
Check System Status#
Log in to Unryo Console → confirm all components show Healthy and Connected.
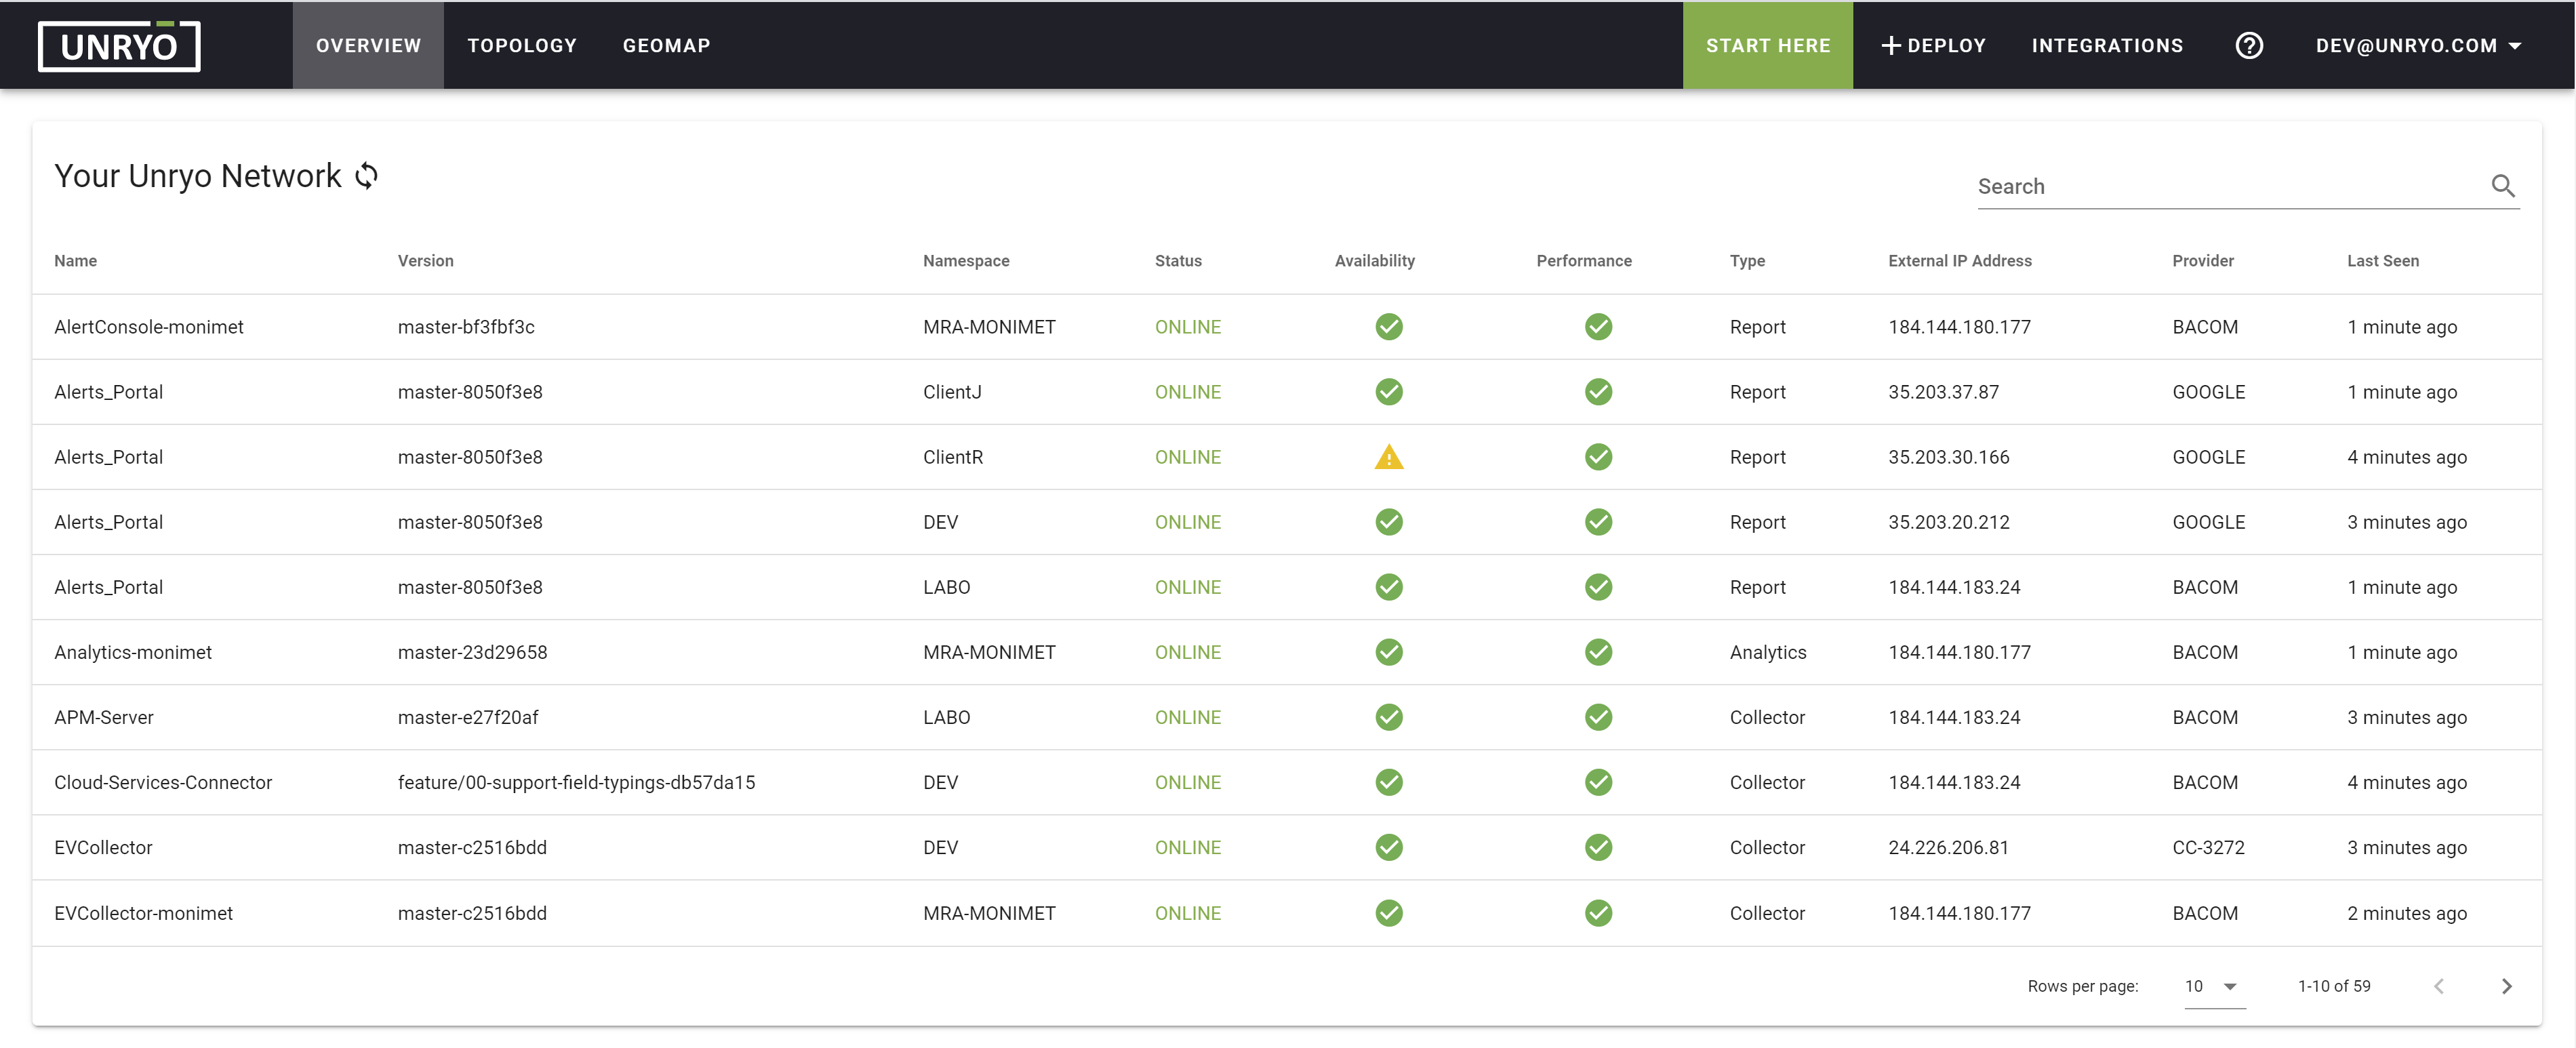
If components show Not Connected:
- Verify host health
- Confirm prerequisites are met
- Check network connectivity
Kubernetes Diagnostics#
  # Check pod status
  kubectl -n my-namespace get pods

  # View recent logs
  kubectl -n my-namespace logs -f --tail 100 <pod-id>

  # Check cluster events
  kubectl -n my-namespace get events

  # Verify services
  kubectl -n my-namespace get svc

  # Access pod shell
  kubectl -n my-namespace exec -it <pod-id> -- bash
Docker Diagnostics#
 # Verify that all containers are running (If a container shows **Restarting** or **Exited**, inspect its logs for details)
 docker ps; docker-compose logs --tail 50

 # View container logs
 docker logs <container-id|container-name>

 # Access container shell
 docker exec -ti <container-id> bash
Next Steps#
Your Unryo installation is ready! Here's how to maximize its potential:
- Connect your data sources using pre-built templates
- Turn on AI and start monitoring with instant visualization and AI insights