Unryo Platform Overview#
About Unryo#
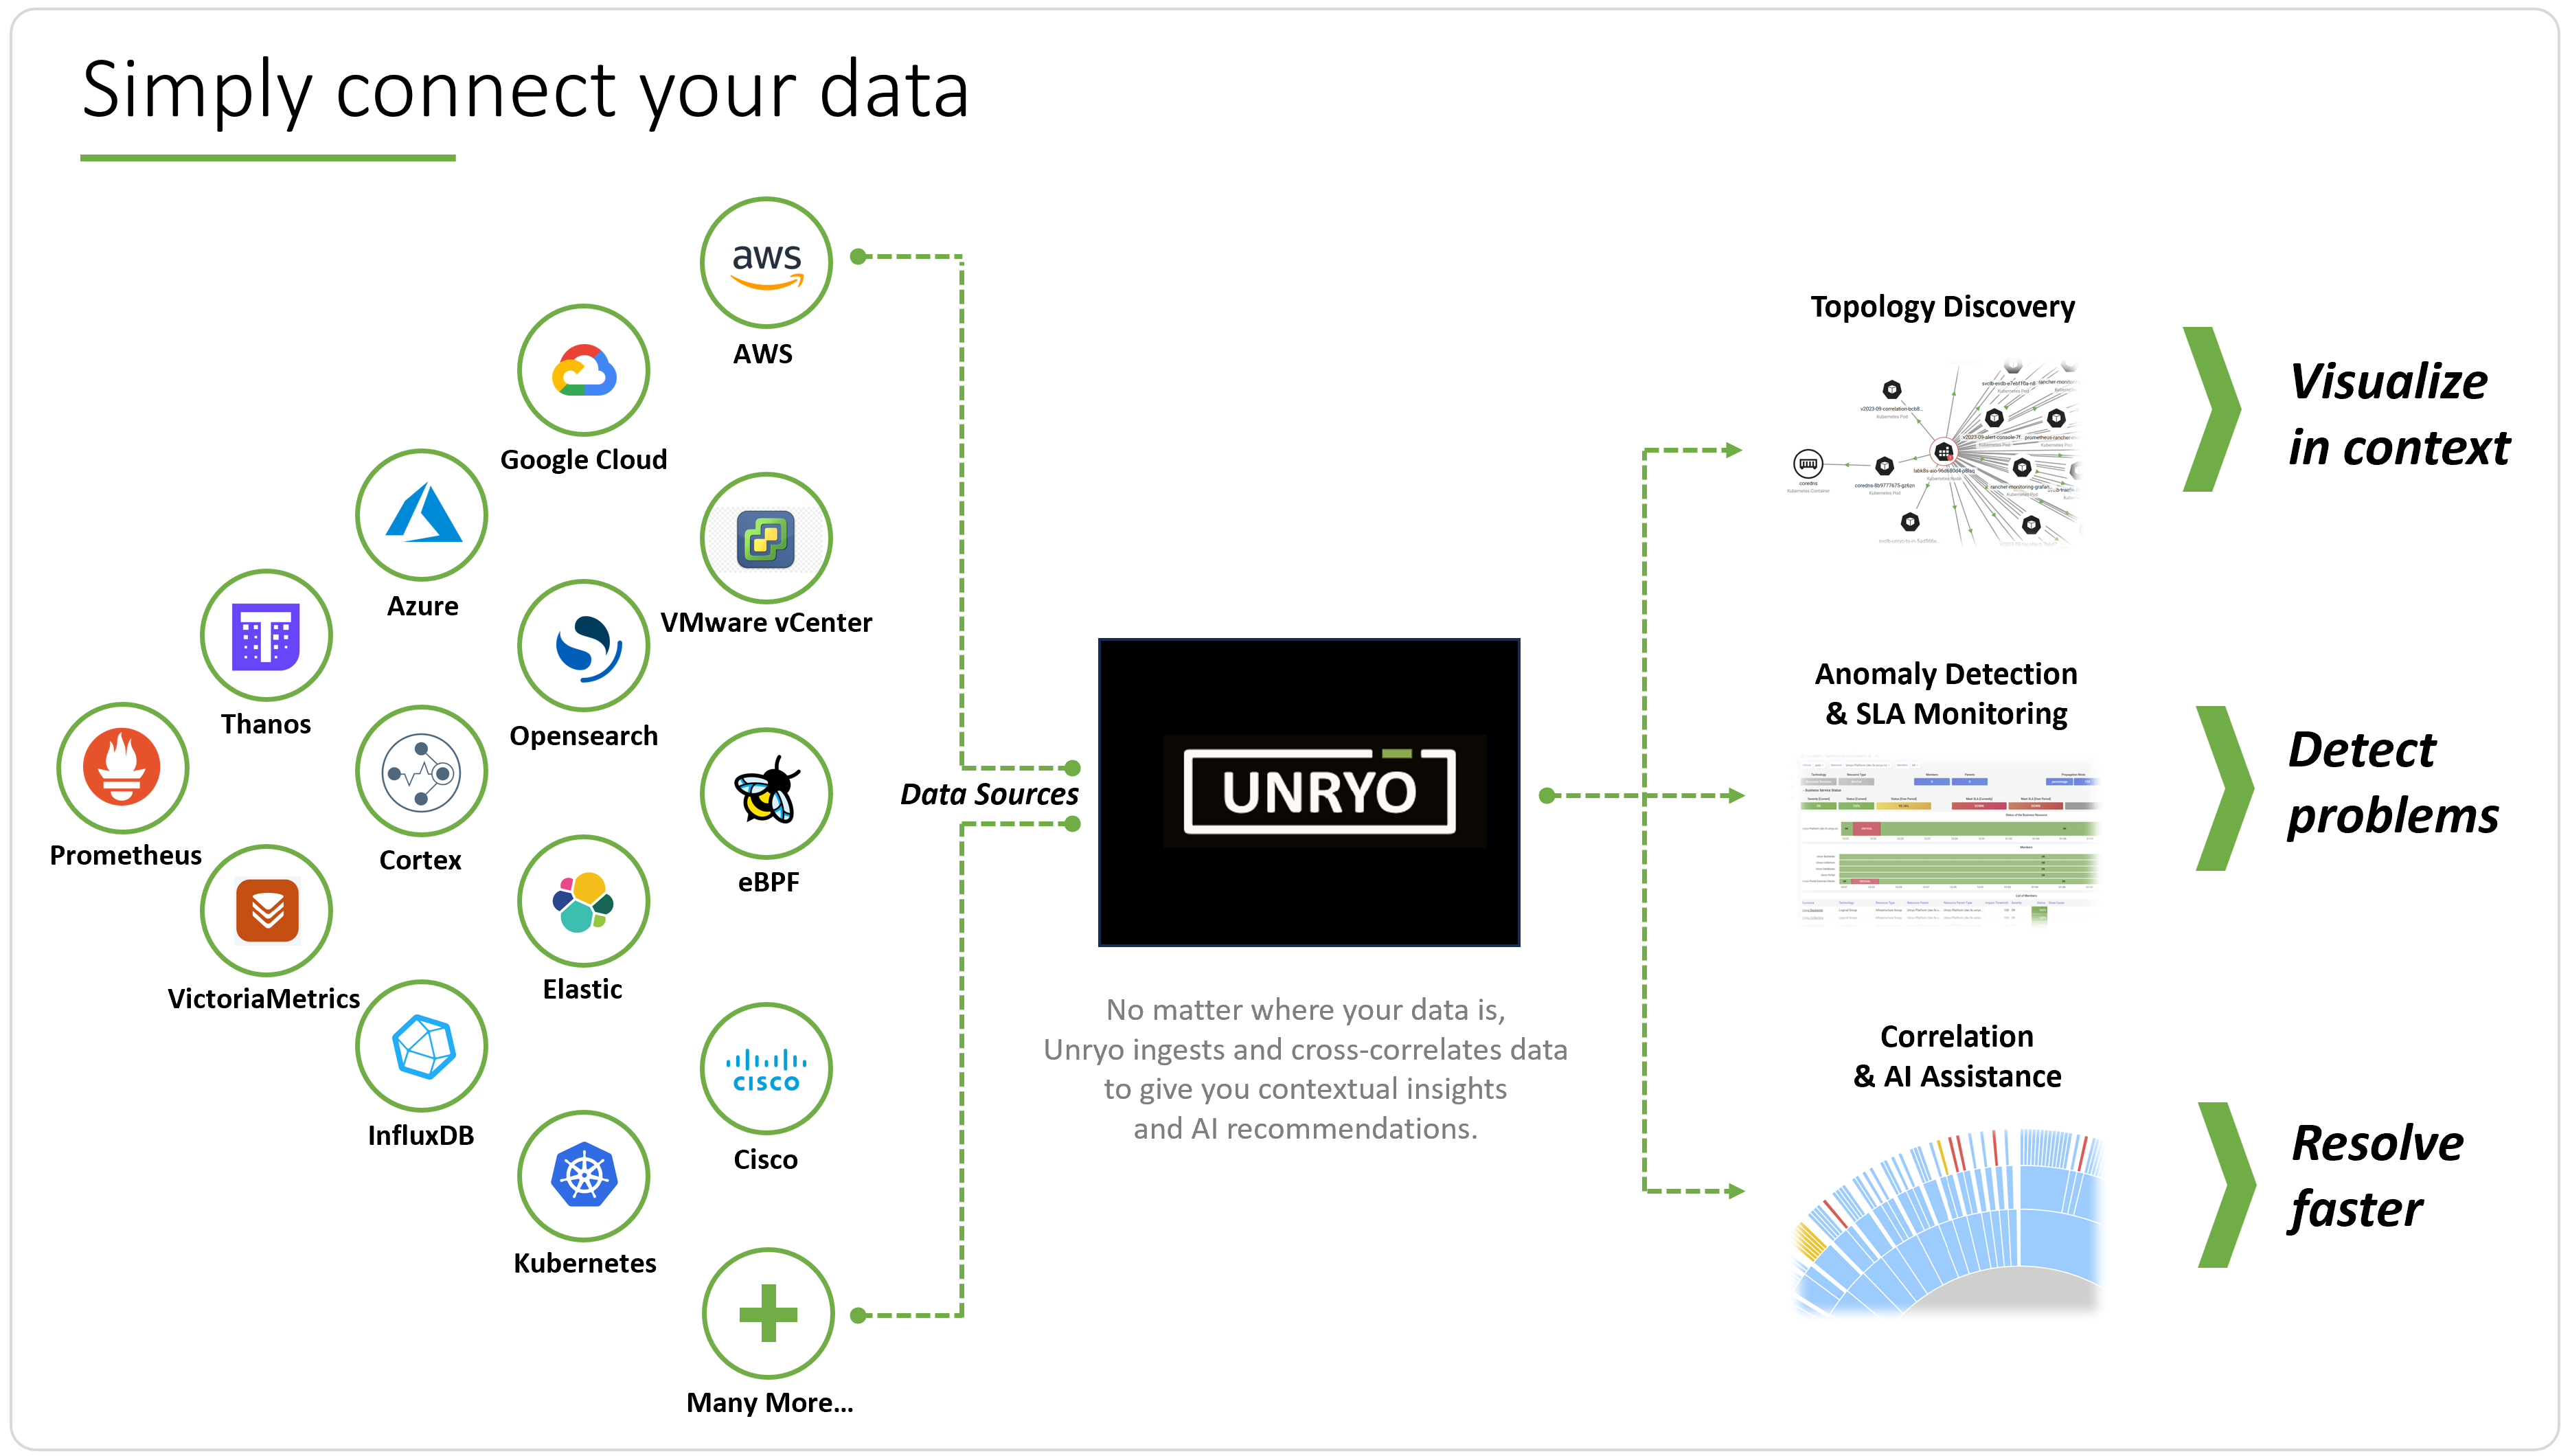
Unryo is a full-stack observability platform.
It connects your infrastructure and your monitoring tools to discover dependencies, correlate and surface problems. Your operation teams get clear insights, dynamic maps, root cause findings and AI recommendations to resolve issues faster.
Unryo is available both as a cloud offering or as an on-premise platform.
Who Uses Unryo?#
| Who Uses Unryo? | Use Cases |
|---|---|
| All Organizations | that use an (CNCF) open-source monitoring stack and look for correlation/AI on top of it. |
| Enterprises | seeking a all-in-one platform to monitor their entire infrastructure. |
| Telcos, Large Enterprises | looking for an on-premise option with strong capabilities on the network & 5G layers. |
Is Unryo replacing my Monitoring Tools?#
You choose! The architecture of Unryo is quite unique as it can work differently to fit your monitoring strategy.
If you have existing observability tools (Prometheus, InfluxDB, Azure Monitor, VictoriaMetrics, Thanos, Cortex, Elastic or others)
Unryo will connect them and analyze key data from them to correlate and surface problems. In other words, Unryo acts as the correlation/AIOps engine on top of your existing monitoring stack to provide central visibility and in-context observability. Your data (metrics, logs, traces) stays in your existing tools and is not duplicated.
If you don't have existing observability tools
Unryo works as a all-in-one observability platform, collecting all data directly from your devices and systems and providing a complete observability solution.
Features#
Data Analysis#
Gather, process and analyse metrics, logs, events and traces from your infrastructure and from your monitoring tools to find insights in real-time. Learn more
Topology Map#
Understand dependencies across multiple layers with a dynamic Topology Engine and automatically rendered maps. Learn more
Correlation#
Find the root cause of a problem, and see affected resources. Learn more
Dashboards#
Library of dashboards, real-time and historical, to visualize infrastructure & service performance for all layers: network, servers, application, IoT, Kubernetes, Clouds, 5G and more. Learn more.
Business Visibility#
Modelize your services in a service impact tree, and calculate SLA compliances. Learn more
Alerting#
Detect anomalies, outages and SLA breaches in real-time, then send notifications to multiple channels (Microsoft Teams, SMTP, Slack, ...
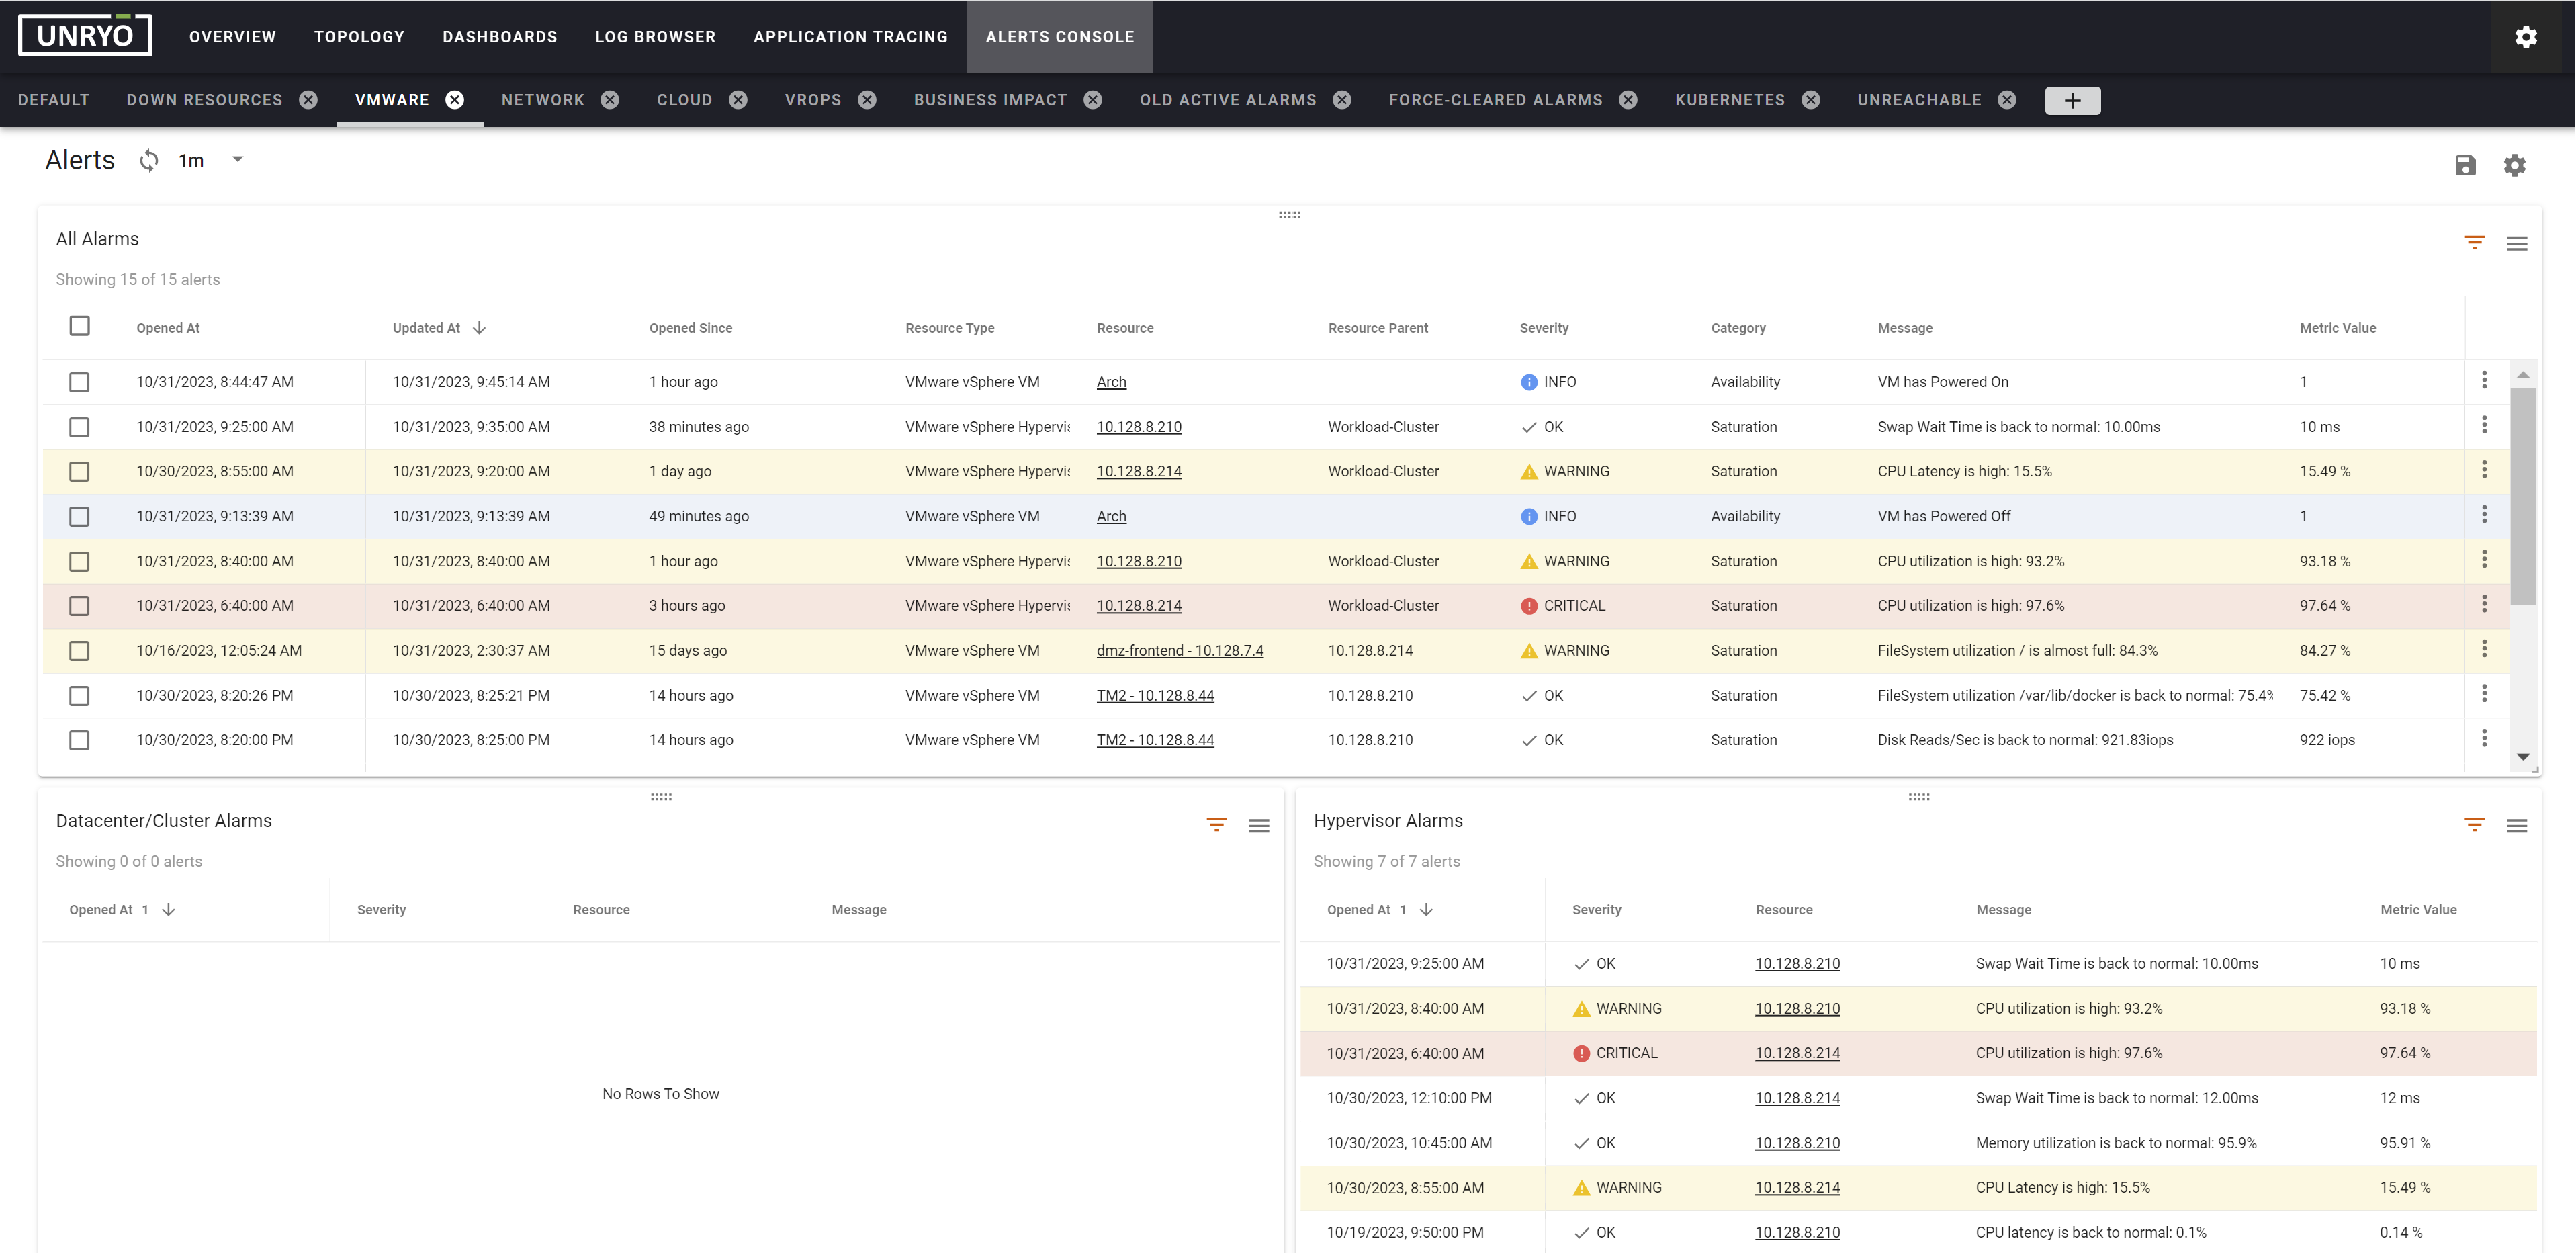
Alerts Console#
Remediate issues with a fully-customizable, multi-panel alerts console integrated with Open-AI ChatGPT. Learn more.
Deployment: Cloud Hosted or On-Premise#
Unryo is available both as a cloud offering or as an on-premise platform.
-
With the on-premise platform version, customers are guided by an easy-to-use wizard to deploy the solution on Docker, on Kubernetes or as a VMware vApp. Customers can install the entire platform on a single host, or distribute components in their data-centers, their clouds and in their customer networks. The magic of Unryo Connect then automatically interconnects all components of your cluster.
-
With the cloud offering, customers only need to install one or more Unryo Collector(s) to start gathering data, getting correlation and viewing dashboards, in just a few minutes. The platform is hosted and managed by us, in the cloud provider and region of your choice.
Architecture#
Understanding the core concepts behind Unryo helps you get the most out of your Unryo solution.
Modular, Cloud-Native Architecture
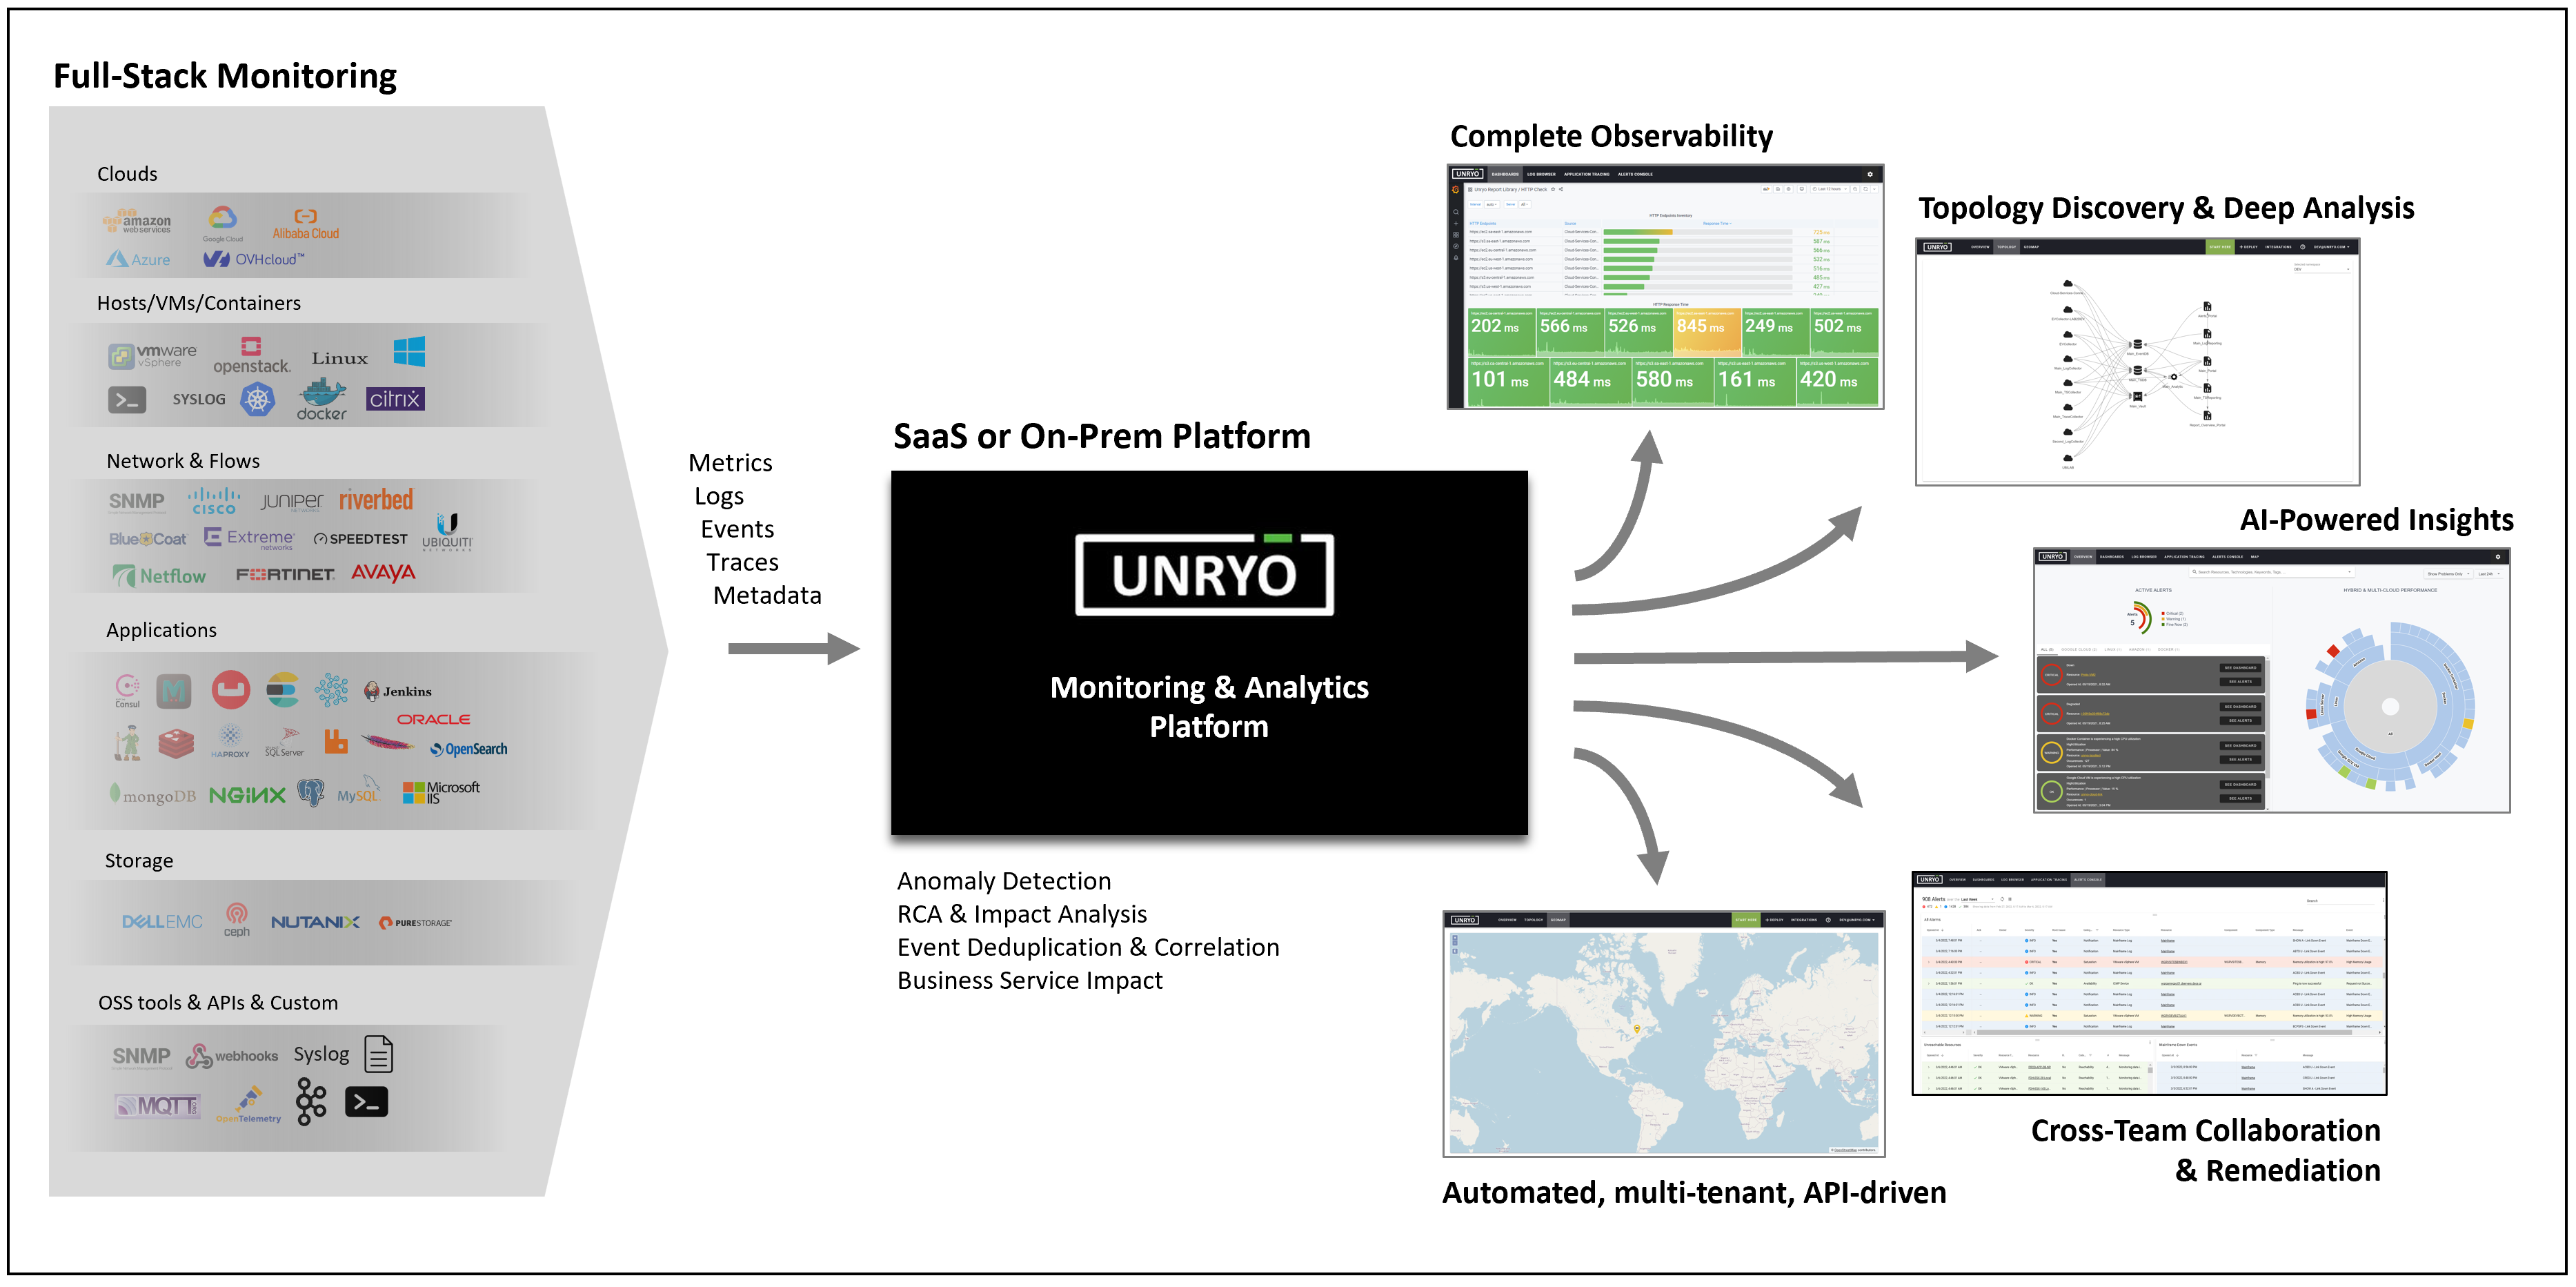
To support flexible and scalable deployments, the Unryo platform is architected into micro-service components. All components are Docker containerized applications, infrastructure agnostic, and play a specific role in the platform. They can be deployed anywhere – on-prem in your datacenters, in your public clouds, or used as a service in our cloud.
Unryo Collectors gather data from your infrastructure and systems. Data is stored and analyzed by the Unryo Time Series Database, the Unryo Event Database, and the Unryo Analytics Engine. All configuration files are encrypted and stored in a secured Unryo Vault, that can reside either in the cloud or on-prem. Finally, the Unryo Portal lets users visualize, explore, monitor and share data.
To get you started quickly, Unryo provides many built-in integrations for the most used data-sources and technologies.
Every component registers itself in Unryo Connect, a central and global cloud registry service that ensures secure and automatic interconnectivity and provides administrators an extremely easy way to control every component, deploy new ones and manage multi-tenancy.
Unryo Components
| Component | Role |
|---|---|
| Unryo Collectors | The Unryo Collector is a lightweight component that you install on host machines in your environment. It gathers metric data – in an agentless way - and event logs from various sources in your infrastructure, enriches them, transforms them, and then sends it in real-time to the Unryo platform. |
| Unryo Time Series Database | Aggregates and stores metrics from all the Unryo collectors and makes it available to the Unryo Portal instantly. It supports high throughput ingestion, compression, real-time querying, SQL-like Queries, and configurable Data Aggregation and Retention. |
| Unryo Event Database | The Unryo Event Database is a real-time search engine, to support log consolidation, monitoring and SEIM use-cases. |
| Unryo Vault | The Unryo Vault is a central component of the platform: it stores and centralizes all configurations from other components, encrypt them, and distributes them when requested, ensuring outbound-only communications. |
| Unryo Configuration UI | This is where admins can set-up everything and manage all the configuration from a single pane. The Configuration UI hides the complexity of operating a large deployment, even when you have to deal with thousands of collectors spread across multiple data centers. Add, update, push telemetry or analytics configurations to one or multiple collectors in clicks. |
| Unryo Analytics Engine | Provides streaming analytics for millions of metrics and events. With machine learning capabilities and statistical algorithms, Unryo detects anomalies and generates alerts. Alerts are visible in the alerts console and can be sent to multiple channels (e.g. Slack, PagerDuty, OpsGenie, etc.) |
| Unryo Topology Engine | Analyzes the metadata attached to data polled, and derives the topology from it - physical or logical. A topology API abstracts complexity of underlying sources, builds nodes and dependancies between nodes, then a topology map displays topology interactively and in real-time. For any given resource, or monitored domains, users can navigate between topology layers: layer 2, VLAN, layer 3, virtualization, Kubernetes, cloud, 5G Core, applications, business services, ... |
| Unryo Correlation Engine | Correlates data, by doing root-cause detection, impact analysis and business impact monitoring across all layers. |
| Unryo Alert Backend | Consolidates event information from the underlying components and controls their full life-cycle (such as acknowledge, clearing). It then exposes the event information to the alerts console, from where operation teams can manage events and invoke tools. |
| Unryo AI Assistant | The AI assistant offloads your operation teams by automating the investigation work. It summarizes, in one view, the situation around the selected alert. |
| Unryo Portal | Lets users visualize, explore, monitor and share data, from anywhere. Contains multiple visualizations to get single pane-of-glass overview, to browse dashboards, see topology dynamically, search logs and manage alerts. |
| Unryo Connect | A central and global cloud registry service that ensures secure and automatic interconnectivity and provides administrators a Console to control and self-monitor the entire platform and deploy new components easily. |
| Unryo ML Packs | To get you started quickly, Unryo provides many built-in integrations, called MLPacks, for the most used technologies – servers, network, applications, clouds and more. Dashboard customization and KPI computation is available so that you can create your own views. |
| Unryo Agents | Lightweight software that you deployed locally on every Unix host and Windows host you want to monitor, when you want local server monitoring. |
| Unryo REST API | Unryo Platform follows an API-first strategy, meaning that everything that is possible to configure trough the User Interface is also programmatically available using APIs. |
Unryo Collector#
The Unryo Collector compartmentalizes a set of specialized containers that gather metrics and logs from your infrastructure. You install the Unryo collector on host machines in your environment. Once installed, the collector registers automatically to your Unryo platform. It then retrieves its configurations from the vault, collects all data and sends the data to the Unryo platform.
Collector Features:
- Resource-efficient and reliable: The Unryo Collector connects a wide variety of sources and devices, sends data in real-time to the Unryo Platform, and works autonomously to keep monitoring continuity even under a prolonged connectivity outage situation.
- Template-based, agentless: After installing a collector, you activate one or more instrumentations (Unryo ML Packs) so that the collector can handle monitoring for a variety of sources, including servers, network devices, applications, IoT sensors. One single collector can collect all your monitoring data, even if your resources are deployed within multiple data-centers or cloud services. It supports multiple protocols, vendors and technologies.
- Secure, outbound-only communications: Unryo uses a service mesh that secures and encrypts all communications between components. Communications are outbound-only as the Unryo Platform never initiates communication with an Unryo Collector. Proxy scenarios are available to support specific security requirements.
- Centrally Controled: The Unryo console controls your distributed collectors, helping you deploy and maintain efficiently at scale. In a few clicks, push a new monitoring template to thousands of collectors at once; and get visual maps on all your deployments, ensuring the entire collector fleet is in good shape.
Go here to learn more on data collection.
Unryo Agent#
The Unryo Agent is a lightweight software that you deployed locally on every Unix host and Windows host you want to monitor, when you want local server monitoring.
The Unryo agents continuously monitors the host global performance (including the operating system, hardware and application processes) and sends the data to an Unryo Collector. You can also extend the monitoring to other technologies by simply activating one of the predefined integrations.
Go here to learn more about the Unryo agent.
Unryo Time Series Database#
The Unryo Time Series Database aggregates and stores metrics from all the Unryo collectors and makes it available to the Unryo Portal instantly. It supports high throughput ingestion, compression, real-time querying, SQL-Like Queries, and configurable Data Aggregation and Retention.
To learn more about metrics, go here.
Unryo Event Database#
The Unryo Event Database is a real-time search engine, to support log consolidation, monitoring and SEIM use-cases.
To learn more: Unryo Log Management
Unryo Vault#
The Unryo Vault receives configurations from the configuration UI and from the Unryo Vault API. The vault encrypts and stores every configuration file, and distributes them to the other components when they securely request it.
To learn more: Unryo Vault
Unryo Configuration UI#
This is where admins can set-up everything, and manage all the configuration from a single pane. The Configuration UI hides the complexity of operating a large deployment, even when you have to deal with thousands of collectors spread across multiple data centers. Add, update, push telemetry or analytics configurations to one or multiple collectors in clicks.
To learn more: Unryo Configuration UI
Unryo Analytics Engine#
Unryo provides streaming analytics for millions of metrics and events. With machine learning capabilities and statistical algorithms, Unryo detects outlier conditions and alerts when data deviates. Alert conditions are customizable, and notifications can be sent to multiple channels (e.g. Slack, PagerDuty, OpsGenie, etc.)
To learn more: Unryo Analytics Engine
Unryo Topology Engine#
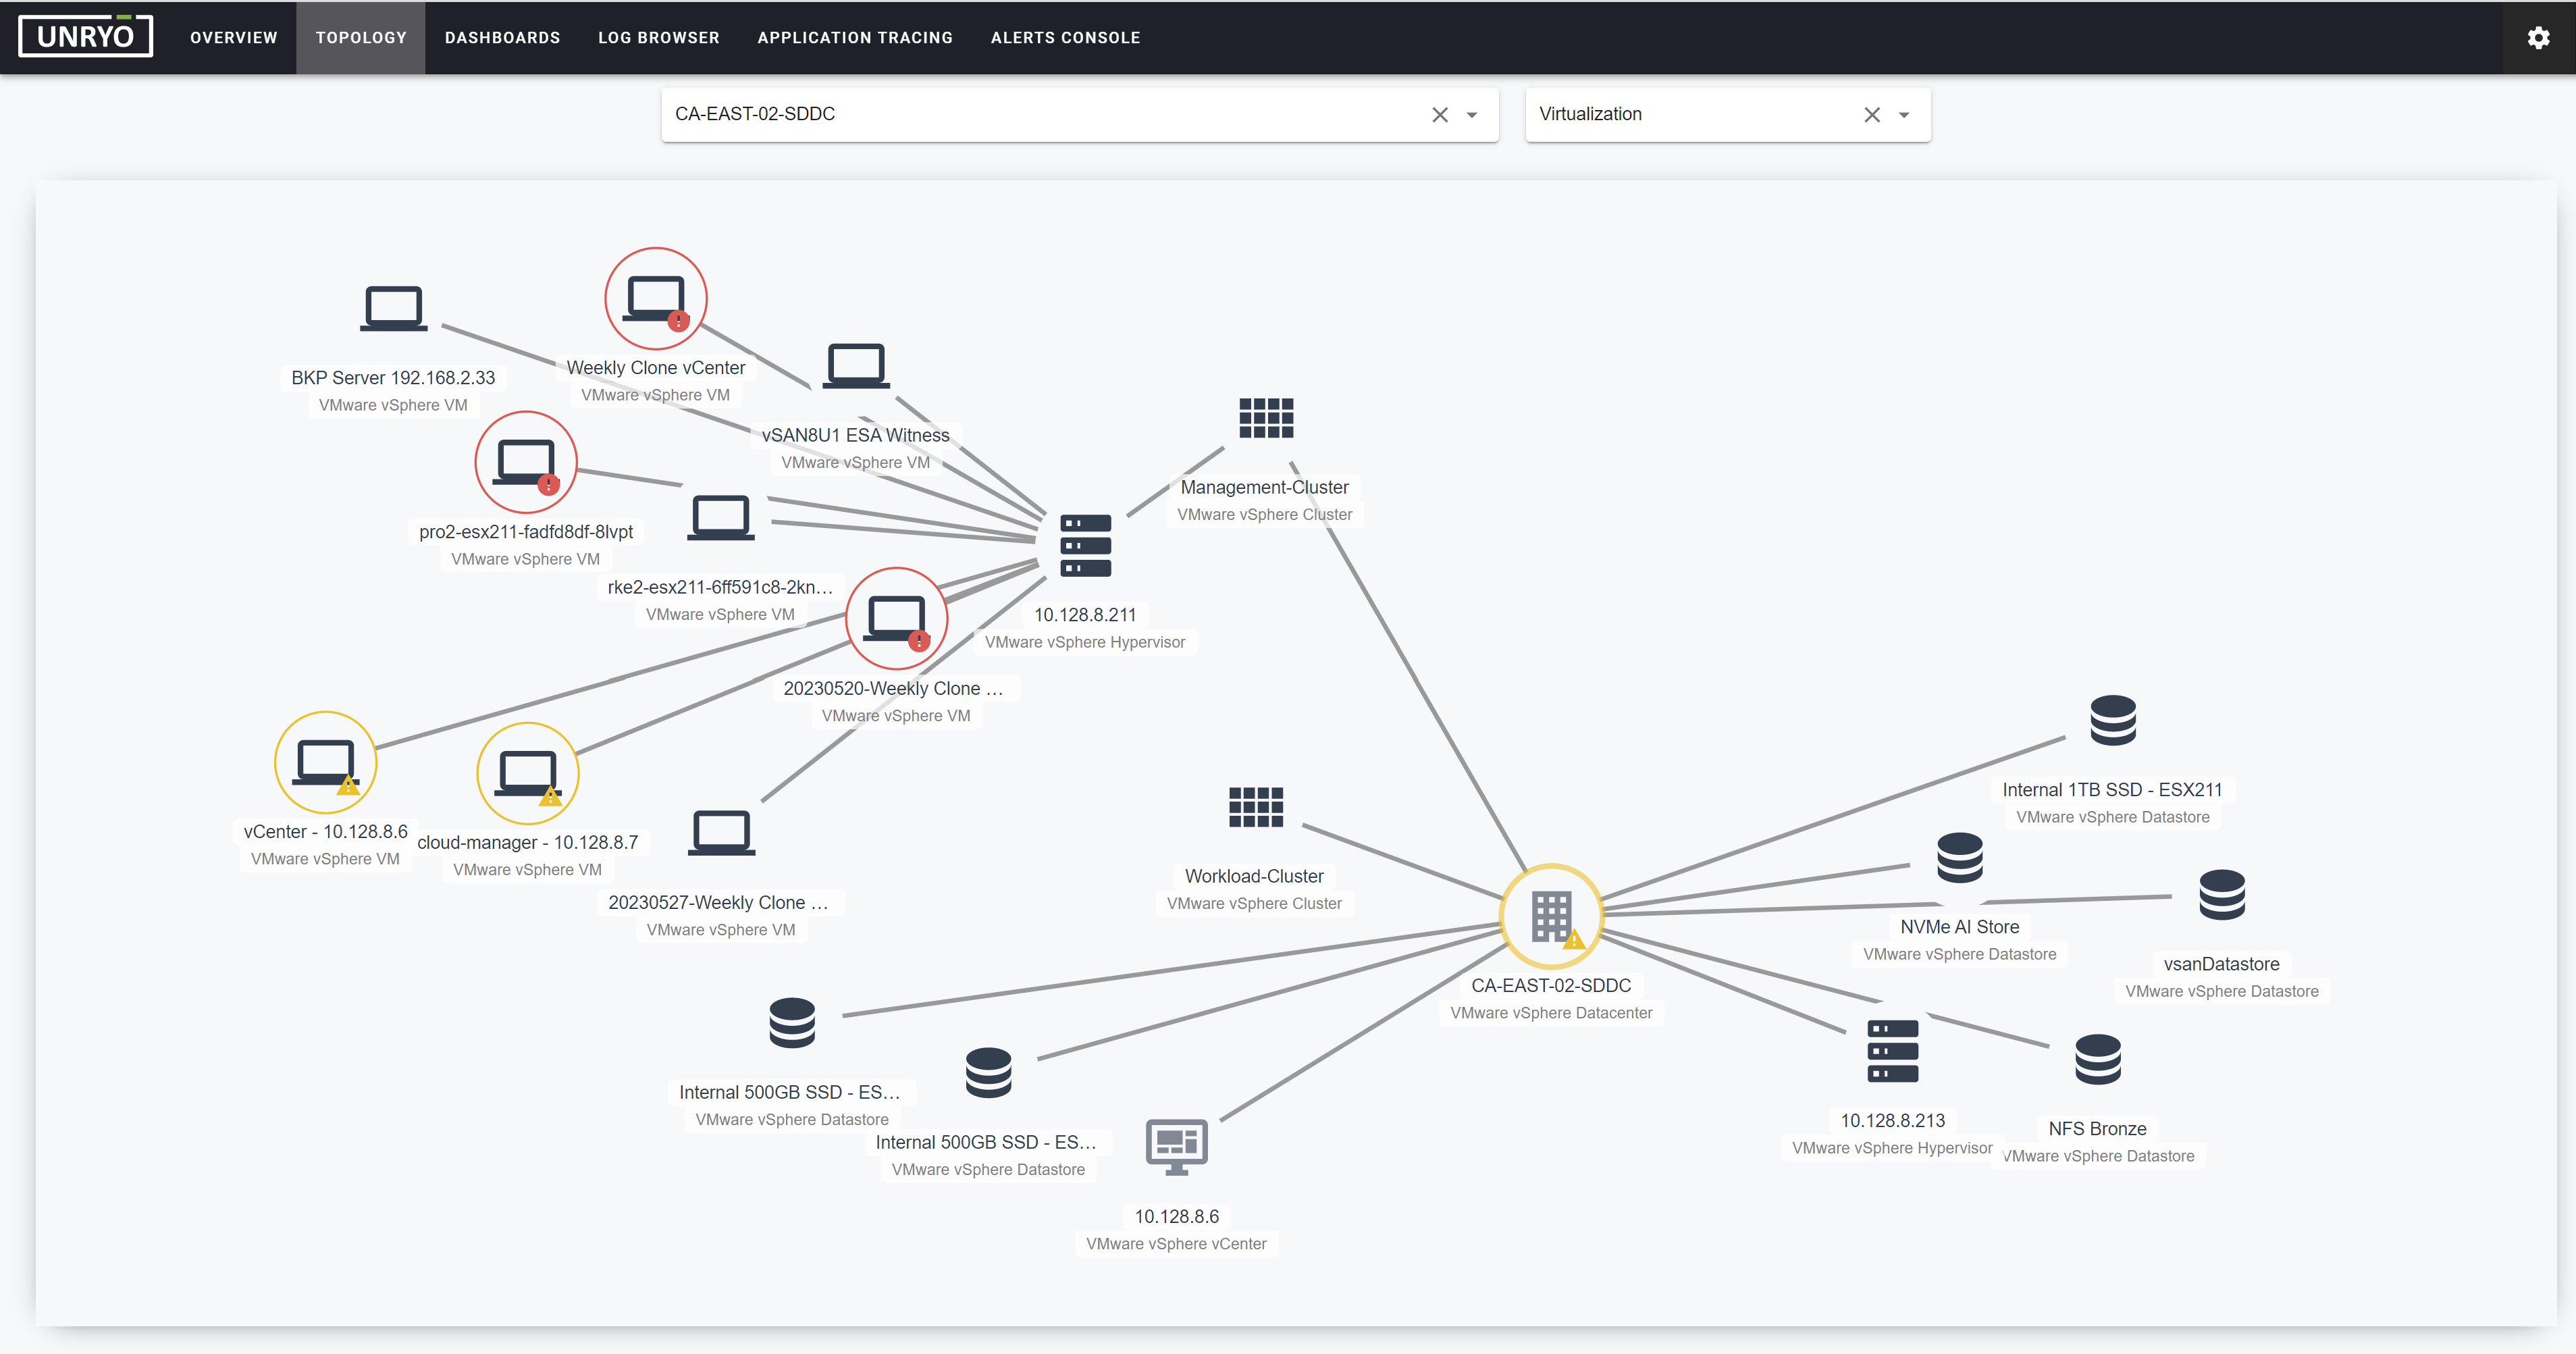
Analyzes the metadata attached to data polled, and derives the topology from it - physical or logical. A topology API abstracts complexity of underlying sources, builds nodes and dependancies between nodes, then a topology map displays topology interactively and in real-time. For any given resource, or monitored domains, users can navigate between topology layers: layer 2, VLAN, layer 3, virtualization, kubernetes, cloud, 5G Core, applications, business services, ...
To learn more: Unryo Topology Engine
Unryo Correlation Engine#
Correlates data, by doing root-cause detection, impact analysis and business impact monitoring across all layers.
To learn more: Unryo Correlation Engine
Unryo Alert Backend#
Consolidates event information from the underlying components, and controls their full life-cycle (such as acknowledge, clearing). It then exposes the event information to the alerts console, from where operation teams can manage events and invoke tools.
To learn more: Unryo Alert Backend
Unryo AI Assistant#
The AI assistant offloads your operation teams by automating the investigation work. It summarizes, in one view, the situation around the selected alert: all the necessary information, why the alert triggered, the context around it, the correlation results, and prepare troubleshooting steps for the user.
To learn more: Unryo AI Assistant
Unryo Portal#
The Unryo Portal is a web application and can be accessed from anywhere. It gives your users and customers full visibility on the entire monitored infrastructure, as a single pane of glass, from high-level overviews down to detailed visualization reports.
Learn more about the Unryo Portal.
Unryo MLPacks#
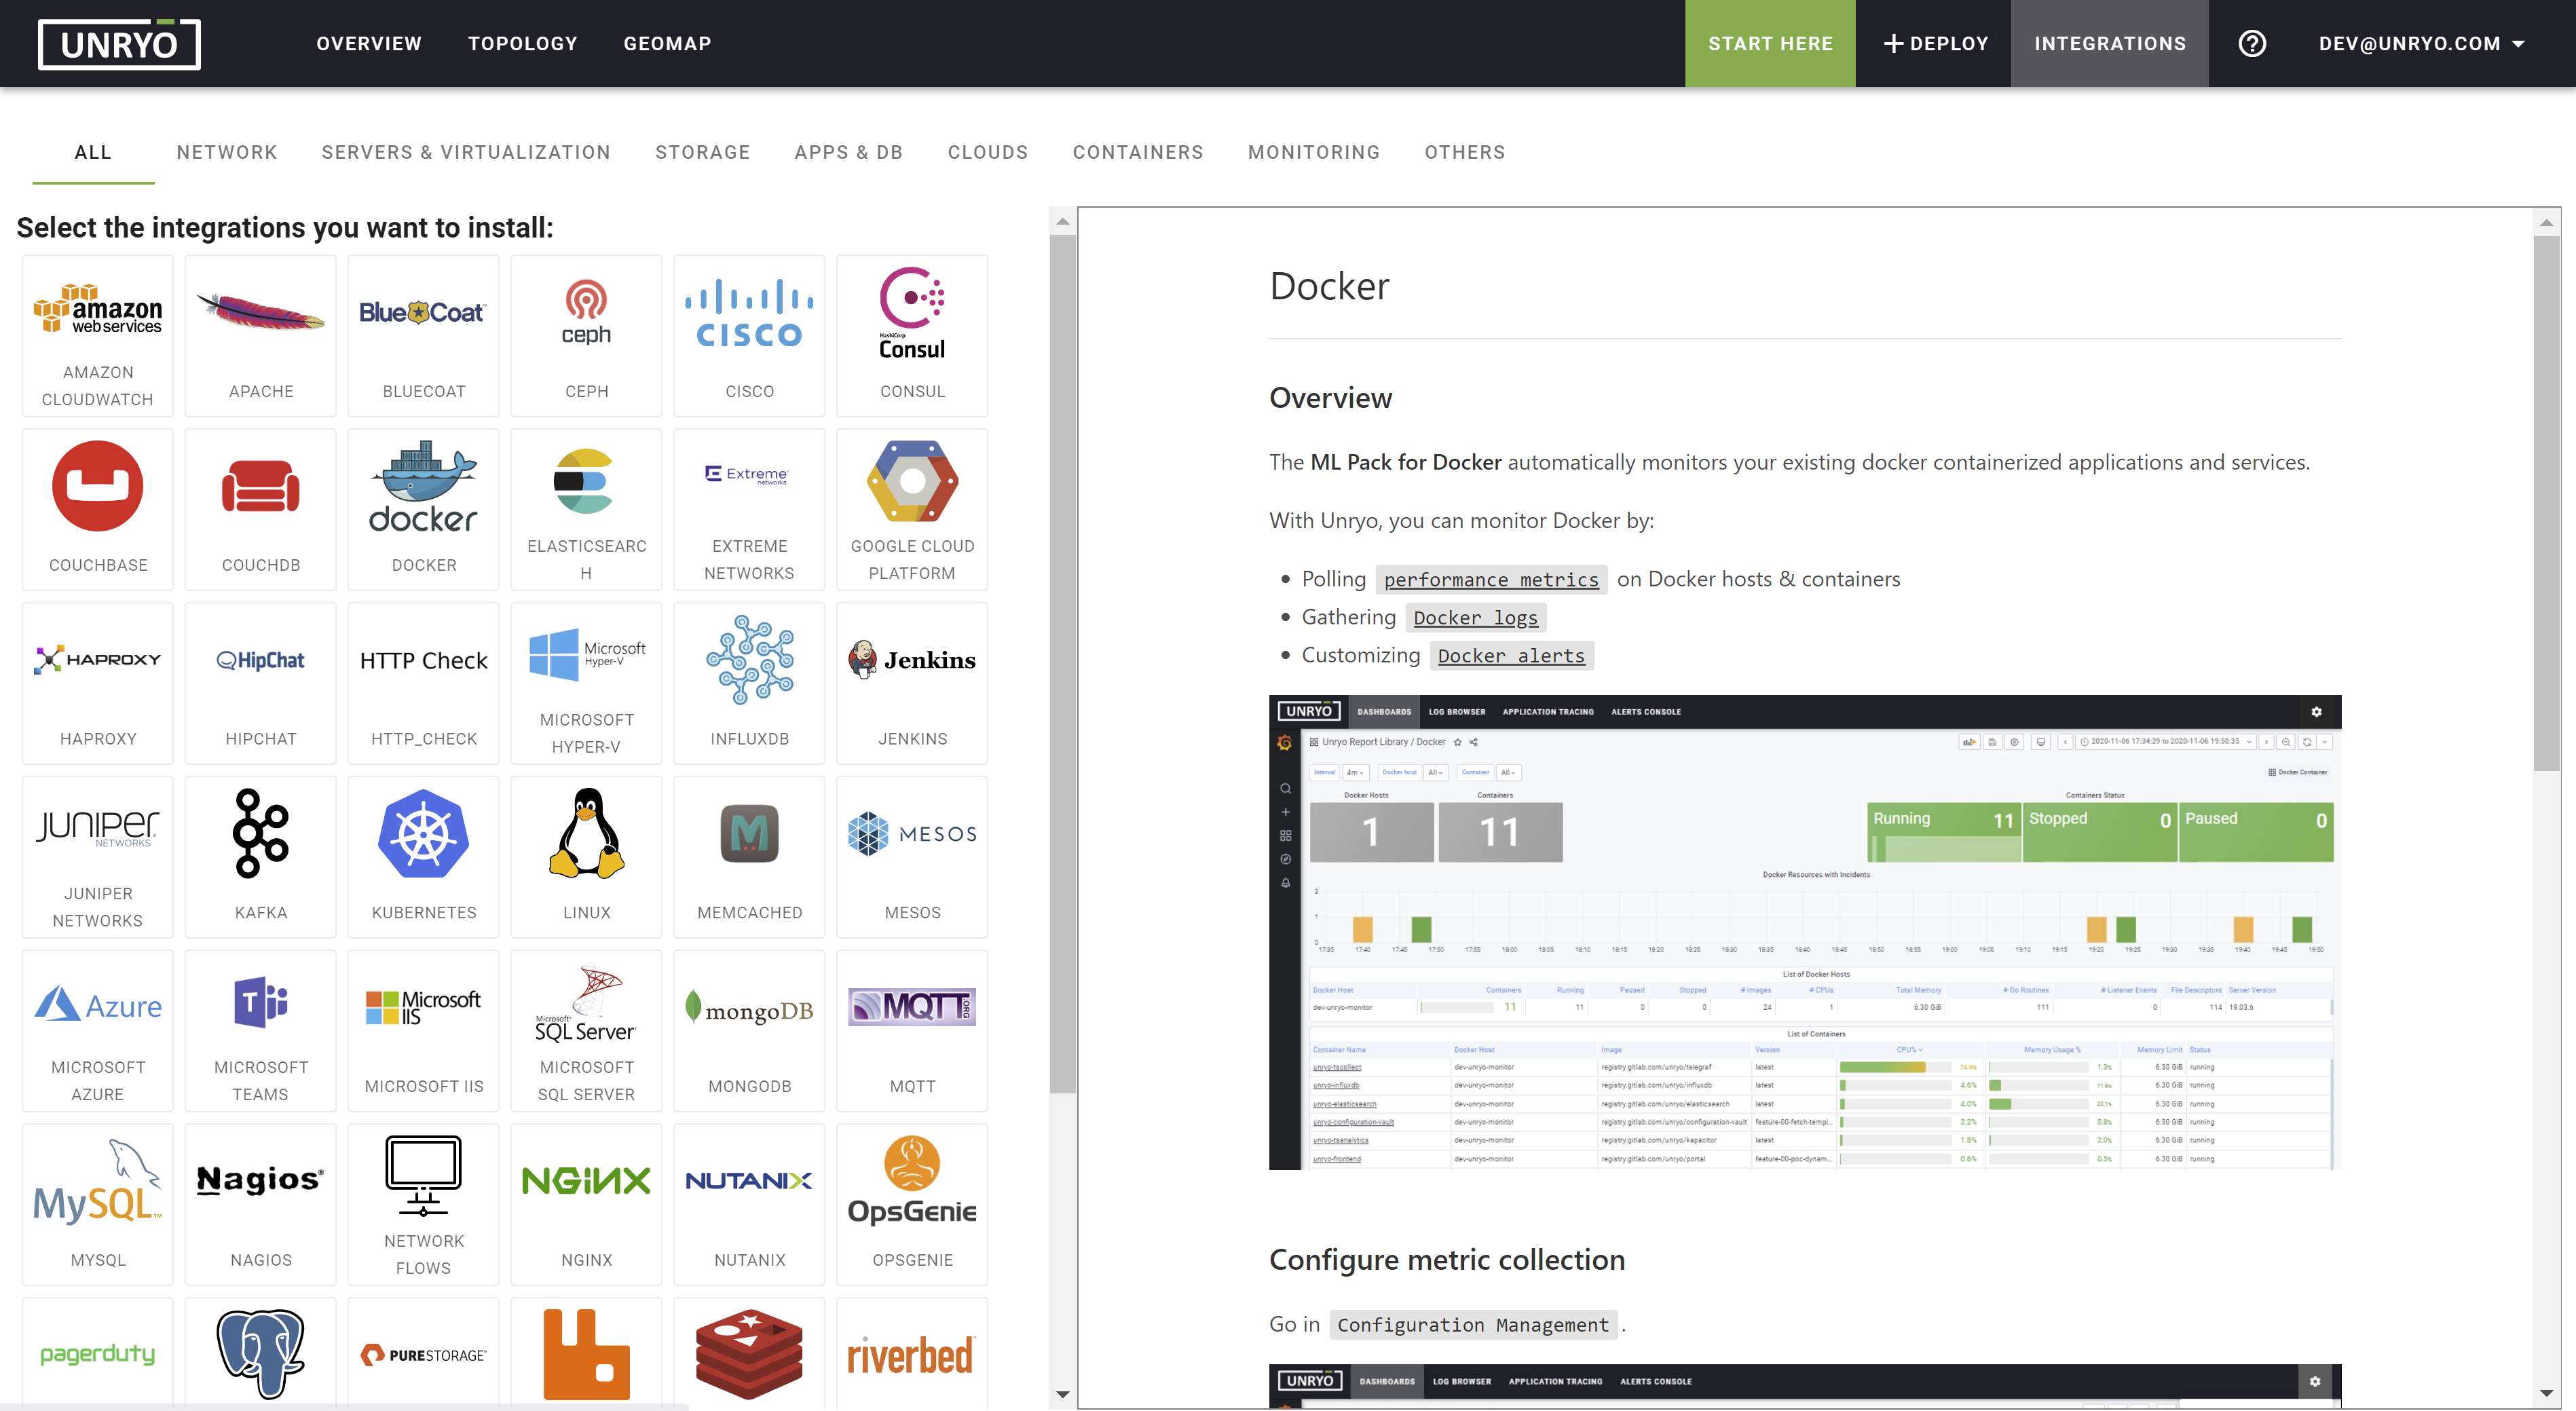
Unryo provides out-of-the-box integrations for the most used technologies and products. Unryo Machine Learning Packs (or Unryo ML Packs) are predefined integrations to monitor a particular technology. They dictate how to collect the data, and how to present it. They contain data collection templates, analytics rules, and predefined dashboards.
See the list of integrations to start collecting data.
Unryo REST API#
Using the Unryo REST API, you can integrate key functions of Unryo into your DevOps stack. The API allows you to interact programmatically with Unryo at every level:
| Key Use-Case | Examples |
|---|---|
| Deployment | Get all nodes |
| Provisioning | Get a configuration, Delete a configuration, Get all templates, ... |
| Data | Get metric values, Configure tagging, ... |
| Topology | Export Topology Data, ... |
| Portal | Get all users, Create a user, ... |
| Alerts | List Alerts, Acknowledge an Alert, ... |
Read the Unryo API reference for further information.
Unryo Connect#
Unryo Connect, our hybrid multi-cloud layer, is based on a cloud registry service that guarantees automatic and secure component interconnectivity in a hybrid and multi-cloud world.
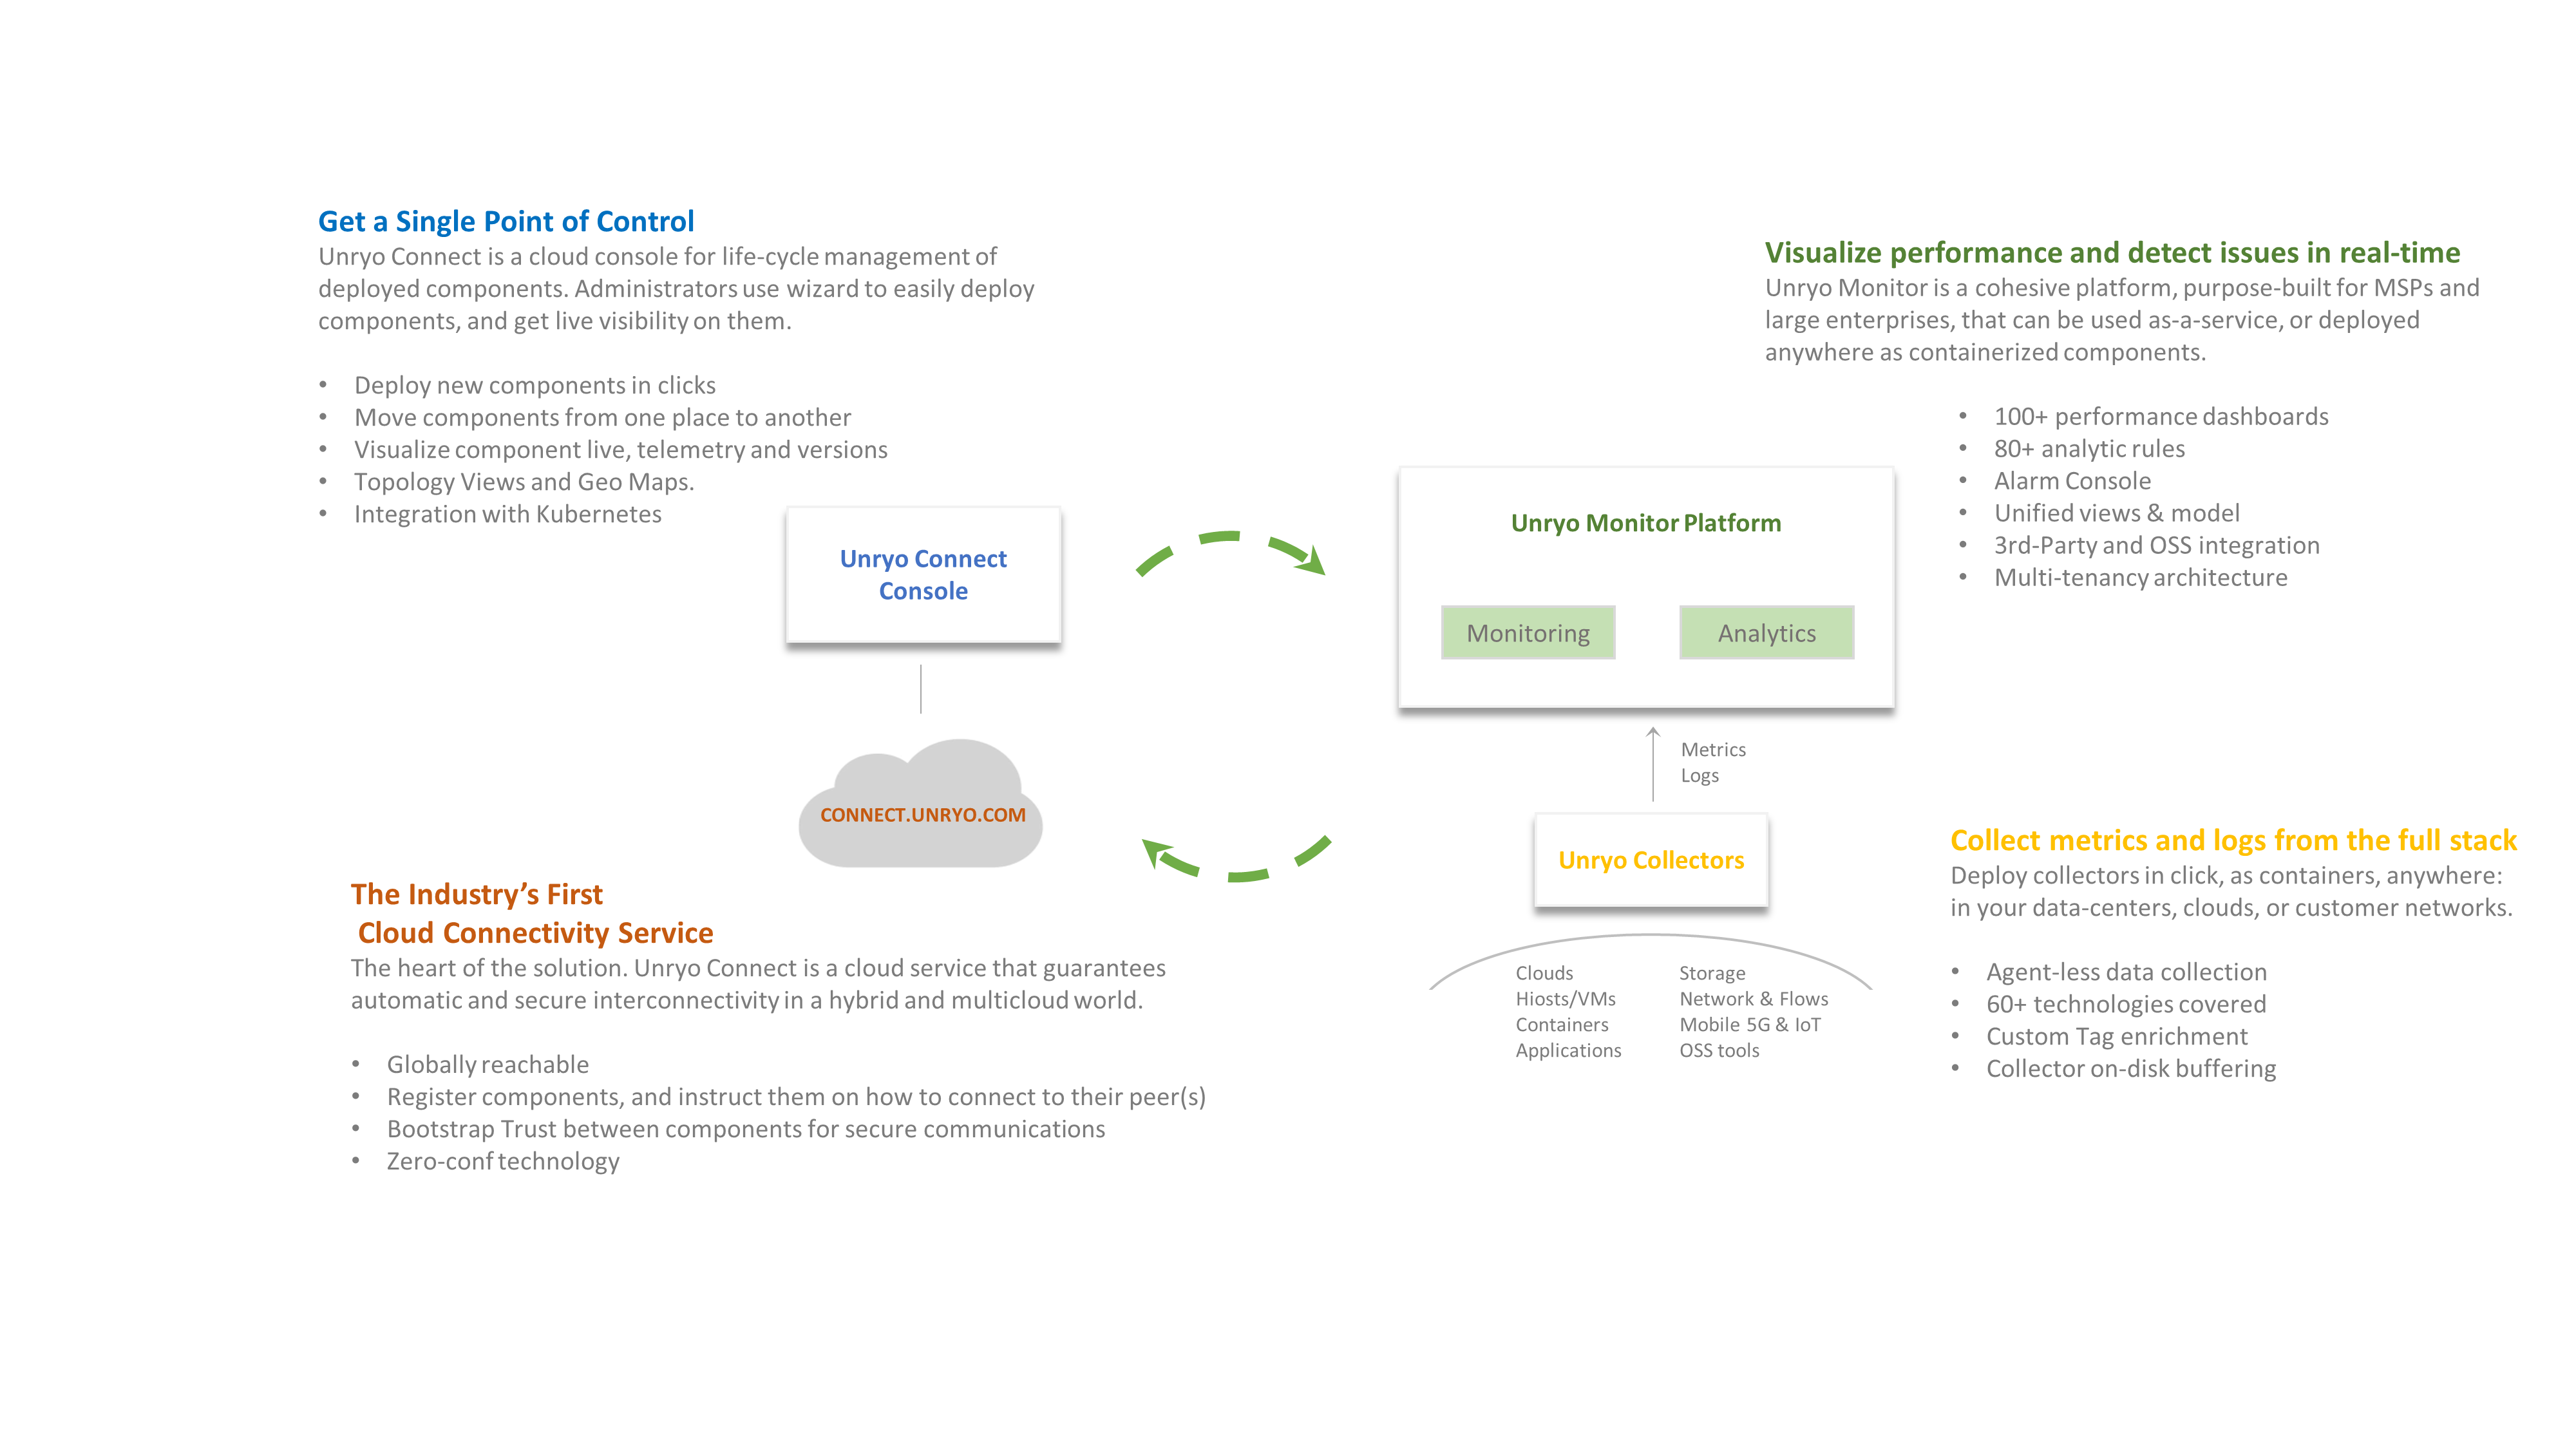
This Cloud Registry Server is centrally reachable and listens for incoming requests from deployed components. It instructs them how to inter-connect securely with each other, whether they are on-prem or in a cloud.
Admins have a console to help them in the complete life-cycle management of the platform and all deployed components.
This console provides:
- a wizard for easy deployment of components
- a live topology map that shows all deployed components, their geo-location and their interconnectivity
- a dedicated self-monitoring for every component: connectivity status, unhealthy service detection, storage issue detection, ...
Finally, the Unryo Connect protocol is open, giving customers that possibility to streamline their monitoring service by certifying their own application or data source. By doing this, the custom application will act as a registered component, will connect automatically with its peer components, will exchange data securely and will be added to the console for live health monitoring. Learn more here: Unryo Connect API.
What makes Unryo unique#
Unryo is built on top of the best open-source products, to enable state-of-the-art data collection, time-series storage, log search, application traces, analytics, and visualization. The Unryo Connect technology, patent-pending, is the heart of the solution. This is the industry-first cloud registry service that connects and manages every distributed component automatically and securely, as one unified, consistent, and ready-to-use system. With that, Unryo gives you the agility to operate your distributed, scalable micro-services architecture in just a few clicks, across all your data-centers and public clouds. The hybrid multi-cloud platform made easy.
Supported Technologies#
Unryo monitors the full stack, from infrastructure to servers to clouds to mobile networks. See the list of ML Packs.
| Domain | Description |
|---|---|
| Kubernetes | Unryo infers the Kubernetes topology and finds insights by querying your available data sources, either Prometheus, Kubernetes API, VictoriaMetrics or others. Insights are presented clearly and with context. |
| Virtual and Physical Hosts | Unryo monitors the performance, capacity, and health of virtual machines, physical hosts, container infrastructures and cloud resources from a single and integrated dashboard interface. |
| Cloud Monitoring | Unryo monitors the performance and availability of your resources from your public clouds (AWS, Microsoft Azure, GCP), as well as cloud service availability. By providing a single dashboard across all locations, you get full visibility of the capacity, performance, utilization, and cost of your cloud resources. |
| Network Monitoring | Unryo increases network efficiency by tracking bandwidth and network latency, resource consumption, overloaded network devices and notifies you before outages occur. |
| Application Monitoring/APM | Unryo shows application performance trends at a glance, by consolidating application traces, analyzing response times, error rates, slow transactions, transaction volumes, for any type of application, including databases, web servers, Go applications, Java applications and more. |
| Log Management | Unryo consolidates logs produced by network devices, servers, applications, and other intelligent or programmable devices. The “Log Management” console enables you to quickly search for specific log messages, based on keywords. Unryo log management also analyzes logs and can alert you if a specific condition is detected. |
| IoT Monitoring | Unryo uses lightweight extensible collectors that can be deployed on the edge, near your IoT devices. Unryo supports a variety of protocols and streaming data to collect, filter and analyze data from IoT devices and sensors |
| 5G Core | Analysis of 5B SBI traffic and correlation between NFV and the Kubernetes infrastructure. |
Documentation Index#
| Topics | Description |
|---|---|
| Unryo Introduction | Learn the basics and major features of Unryo |
| On-Prem Install | Install Unryo in your environment as a vApp, on Docker or on Kubernetes |
| Unryo Cloud | Create your Unryo account and start using Unryo Cloud |
| Deployment Options | Add collectors, server agents or fine-tune your platform set up |
| Gather Data | Gather metrics, topology dependencies & events from your infrastructure, apps, and services |
| Visualize | Browse dashboards, search and get insights across the full stack |
| Correlation & Alerting | Discover the power of Unryo analytics, RCA and ML |
| Configure | Learn how to customize the platform and integrate your data |
| Manage | Control & Administer your Unryo System |
| Supported Technologies | See the list of turnkey integrations (Unryo ML Packs) |
| Unryo API | Integrate Unryo with your own systems using the Unryo API |
| Unryo Glossary | Read definitions of Unryo terms |
| FAQs | Questions? Find answers. |
| Contact Support | We’re here to help you! |