Configuration UI & Vault#
In Unryo, all your configurations are stored encrypted in a vault, which serves as the communication channel back to your collectors and other components (analytic engine, topology engine, ...).
About the Vault#
How the Vault works?#
Every configuration you create is stored in the Unryo Vault, and from there, is distributed to the target components.
The role of the Unryo Vault is to encrypt, store, and distribute your configurations to the rest of your components.
To distribute configurations, the vault never initiates the communication, so that the communication from the target components (for example the collectors) to the Unryo platform is outbound only.
Accessing the Configurations#
Administrators access the configurations stored in the vault via the Configuration UI and via the Vault API.
We highly recommend you do all components configuration via the Configuration UI or via the Vault API when you wish to automate your configuration tasks.
Using the Configuration UI#
The Configuration UI is where admins can set-up everything, and manage all the configurations from a single pane. It hides the complexity of operating a large deployment, even when you have to deal with thousands of collectors spread across multiple data centers. Add, update, push telemetry or analytics configurations to one or multiple collectors in clicks.
Access the Configuration UI#
Go to Settings > Configuration Management
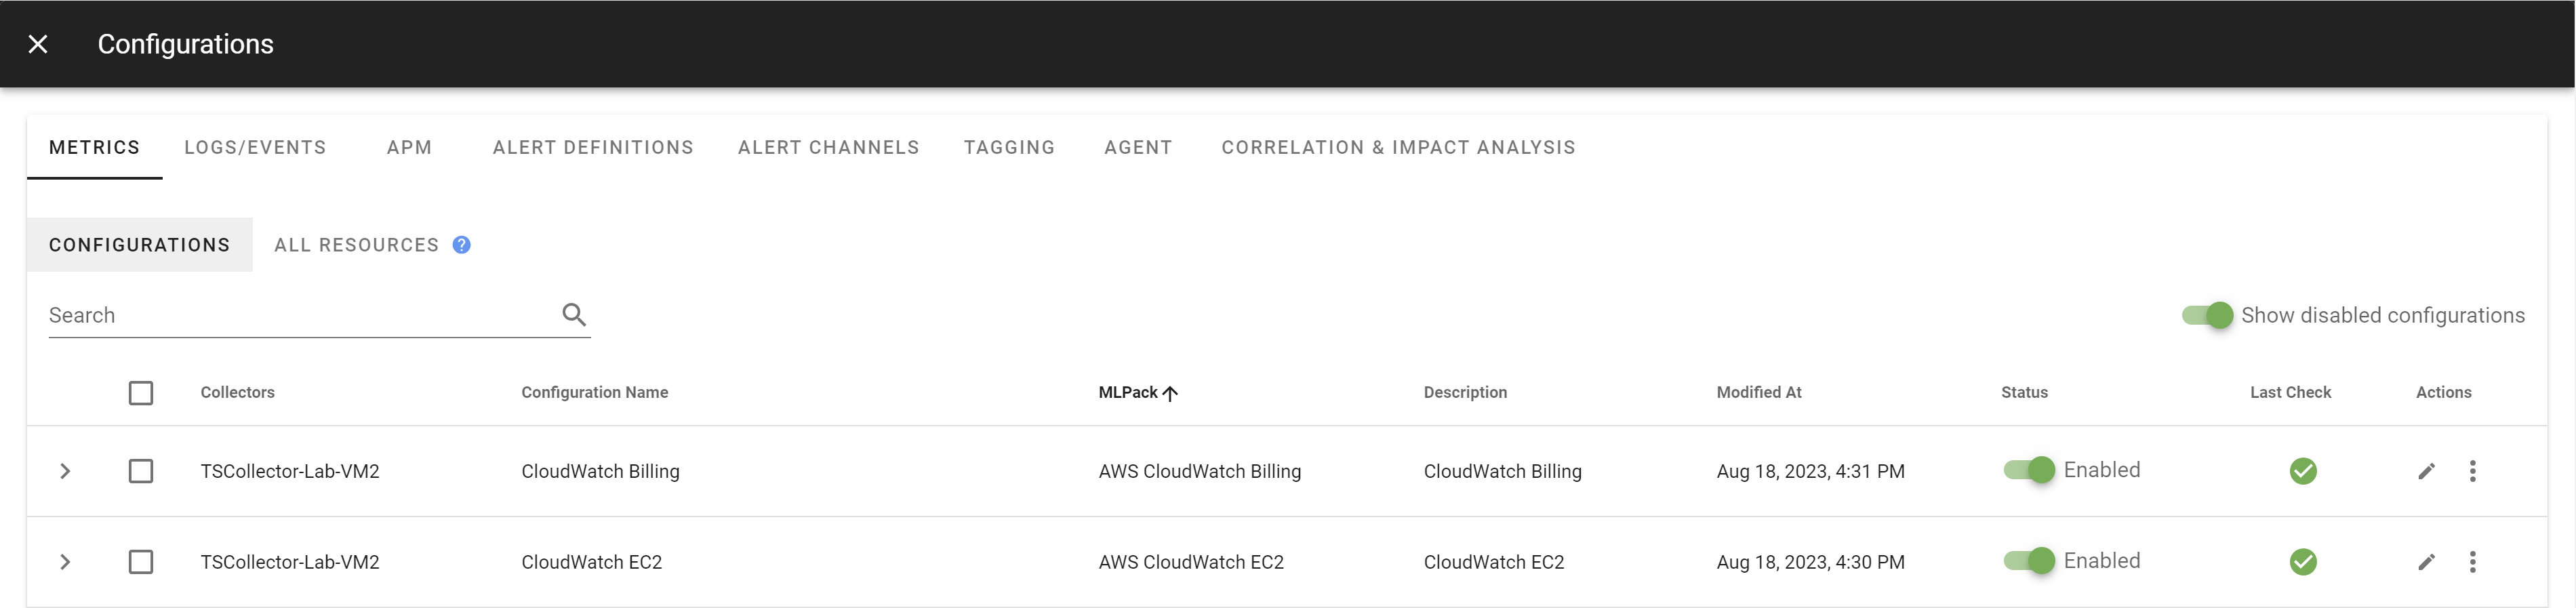
The Configuration UI allows you to edit and deploy configurations to all your platform components.
The Configuration Management has the following tabs:
| Tab | Description |
|---|---|
| Metrics | Configure your collector(s) to gather metrics. Dozens of templates are available to collect data from a variety of sources and to send collected data to a variety of destinations. |
| Logs/Events | Configure your Unyro Log Collector, to receive logs or events (Syslogs, Kafka messages, Webhooks, Flows, 5G records, SNMP traps, ...) from your managed infrastructure. |
| APM | Indicate how to instrument your applications such that they emit traces. |
| Alert Definitions | Configure your Unryo Timeseries Analytics engine. It allows you to configure automatic alerts that will be sent to you when certain conditions are met. For instance, you can ask to receive an alert when a device on your network has very high CPU usage. You can also configure your Timeseries Analytics engine to transform and combine your data, thus computing new metrics of interest to you and adding them back to your Unryo Timeseries Database. |
| Alert Channels | Configure channels via which you may want to receive your alerts, such as Teams, Slack and email. The channels you configure here can be used in the Alert Definitions configurations, for instance by adding .teams() to send alerts to Teams. |
| Tagging | Specify tags or fields that will automatically be added by the Unryo Timeseries Collector. For instance, you may want all data collected in a certain region to be tagged in a specific way. |
| Agent | Push configurations to your agents deployed on monitored Linux and Windows hosts. |
| Correlation & Impact Analysis | Configure root-cause and impact analysis. |
Add a configuration#
Builtin configurations: We provide you with several configuration out of the box! These are for common usecases, such as collecting several performance metrics from your Linux machines and for alerting you when one of your component has very high CPU usage.
-
Click on the
+button to add a new configuration.It will open the following screen:

There are 4 required fields and one optional field when adding a new configuration.
-
Select your template.
This will provide you with a sample configuration you can use as a starting point for creating your configuration.

You may customize the sample configuration to your heart's content! Make sure you know what you are doing though. When in doubt, stick closely to the sample and consult our MLPack documentation, provided via the Configuration Instructions link on the bottom left.
-
Next, select the component to which you wish to send the new configuration to.

-
Lastly, provide a name to your new configuration.
This will allow you to recognize your configuration again later. Make sure this name is meaningful.

You may also want to provide a description for your new configuration. This is optional.
When you are ready, click on Apply and voilà! You have added a configuration, which will be applied to your component in a matter of seconds.
Enable/disable a configuration#
Enabling/disabling is done via the buttons on the Status column.
- When enabled, the configuration is sent to the corresponding components.
- When disabled, the configuration is kept in the vault but is no longer sent to your Unryo platform' components. It is also not returned in some API calls.
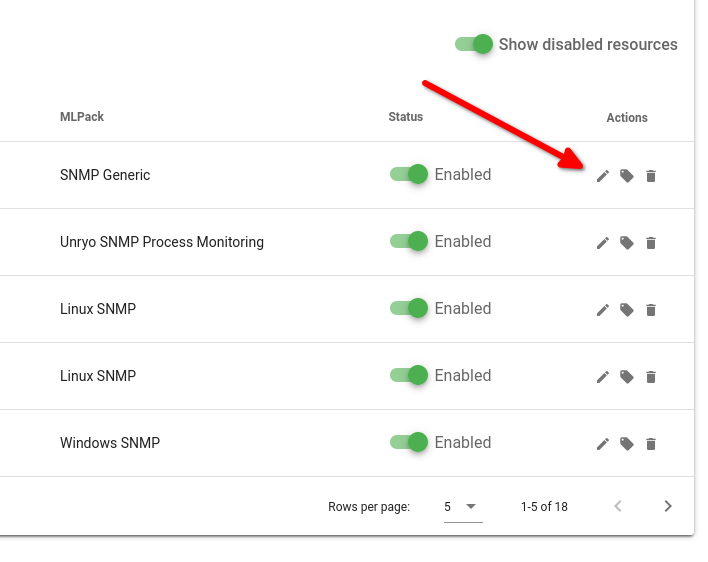
Edit a configuration#
Editing a configuration is done via the pencil icon in the Actions column. When you click this icon, the interface appears with all fields prepopulated using the information provided when creating the configuration.
Duplicate a configuration#
Duplicating a configuration is done by clicking on the three vertical dots in the Actions column and clicking on Duplicate. This will create a copy of the configuration. The copy will have a slightly different name and will initially be disabled.
Delete a configuration#
Deleting a configuration is done by clicking on the three vertical dots in the Actions column and clicking on Delete. This will permanently delete the configuration from your vault and from all components that received the configuration.
Built-in configurations can't be deleted. If you don't plan to use them, simply disable them.
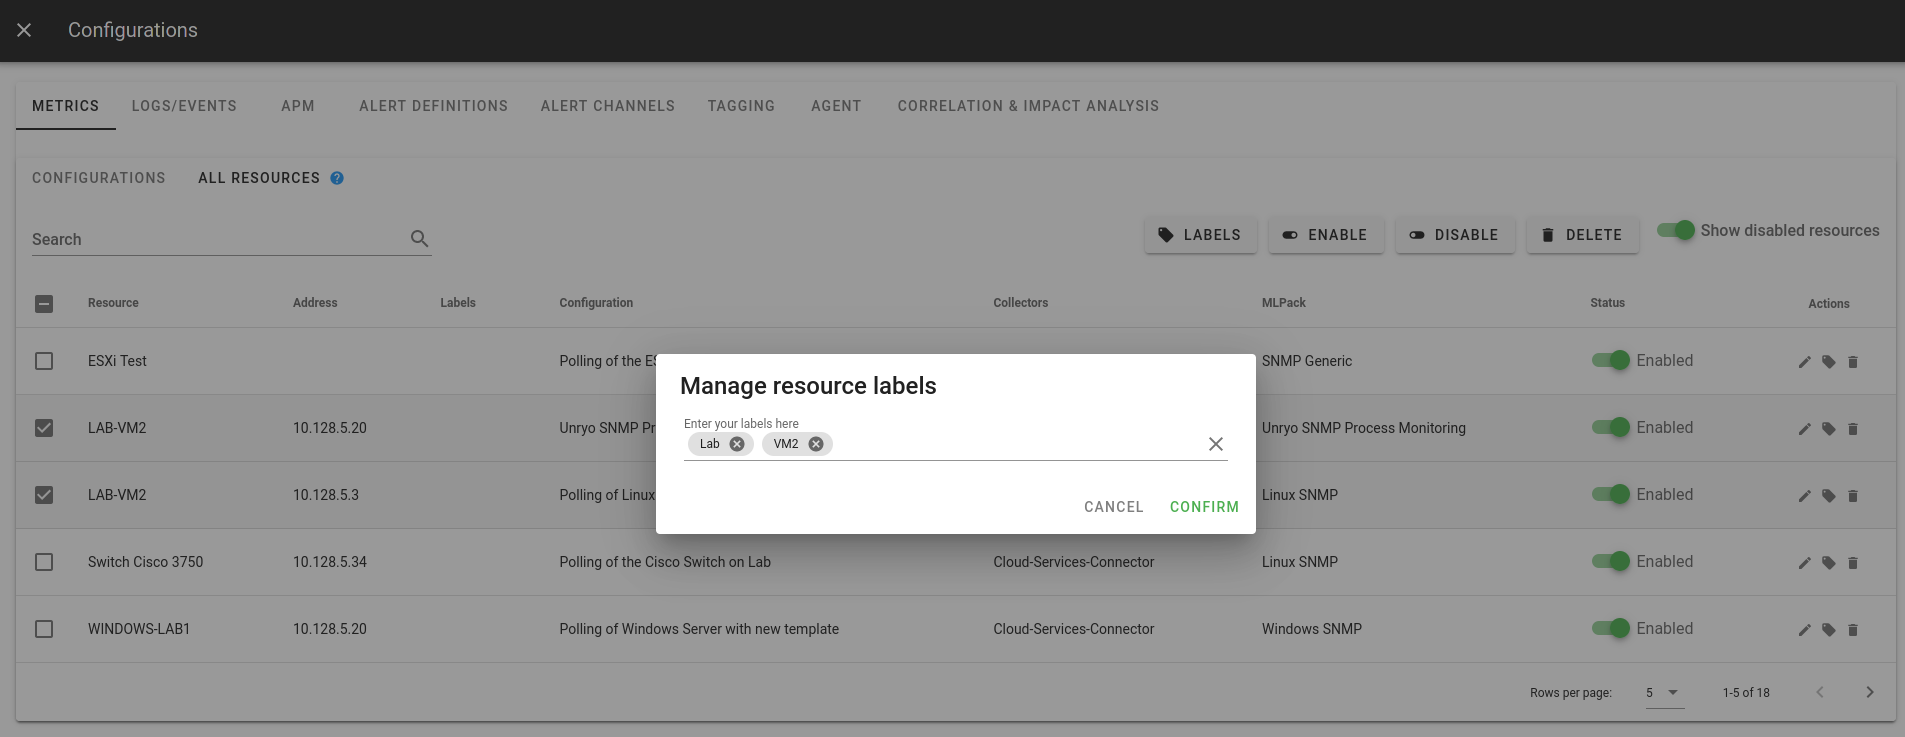
Multi-select actions#
On the far left of each Configuration UI tab, there is a multi-selection column. When you select one or more configurations, three additional buttons appear at the top of the tab.
This allows you to Enable, Disable and Delete multiple configurations at once.
Show/hide disabled configurations#
At the top right of each tab there is a Show disabled configurations button
you can use to show or hide disabled configuration.
The All Resources tab#
The All Resources tab shows all supported resources in one place. Those resources are the one that can be discovered (i.e. SNMP devices, TCP/UDP ports, ...)
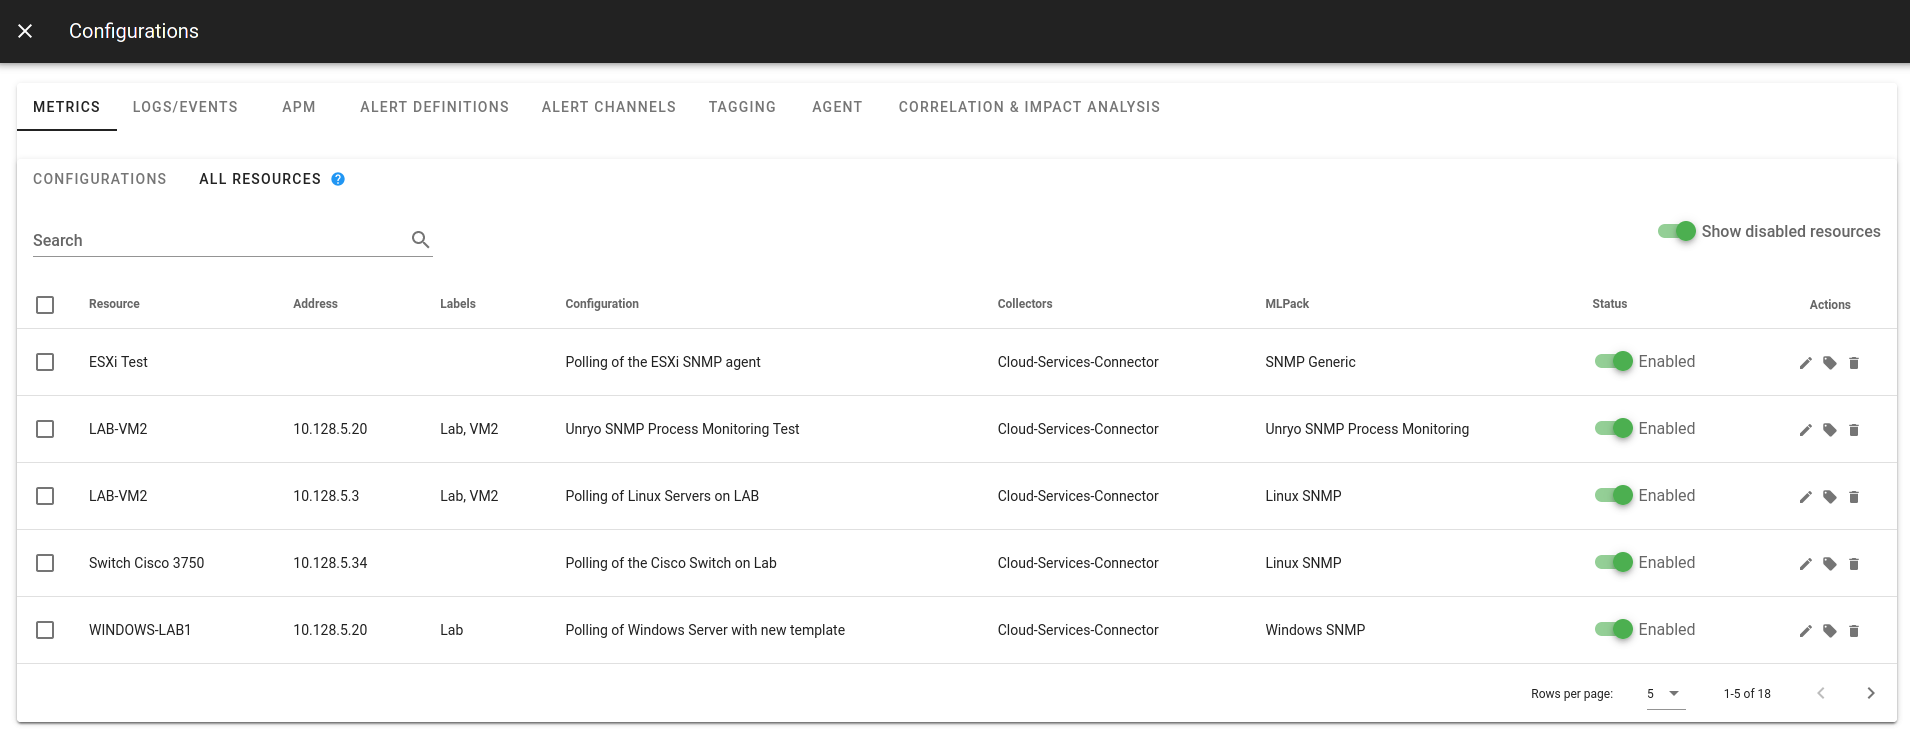
It makes easier finding what resources are currently being monitored and quickly enable, disable or even delete them.
We can also group them by adding labels either individually or by selecting multiple resources and using the "Labels" button
There's also the ability to directly open the configuration to which this resource belongs by clicking on the pencil icon.