Kubernetes#
Overview#
Unryo gives real-time visibility inside your Kubernetes cluster(s).

How it works#
Unryo infers the Kubernetes topology and finds insights by querying your available data sources, either Prometheus, Kubernetes API, VictoriaMetrics or others.
Insights are presented clearly and with context. Your teams are informed about the probable root-cause, the impact magnitude and get AI-driven recommendations to resolve the problem rapidly.
Features:
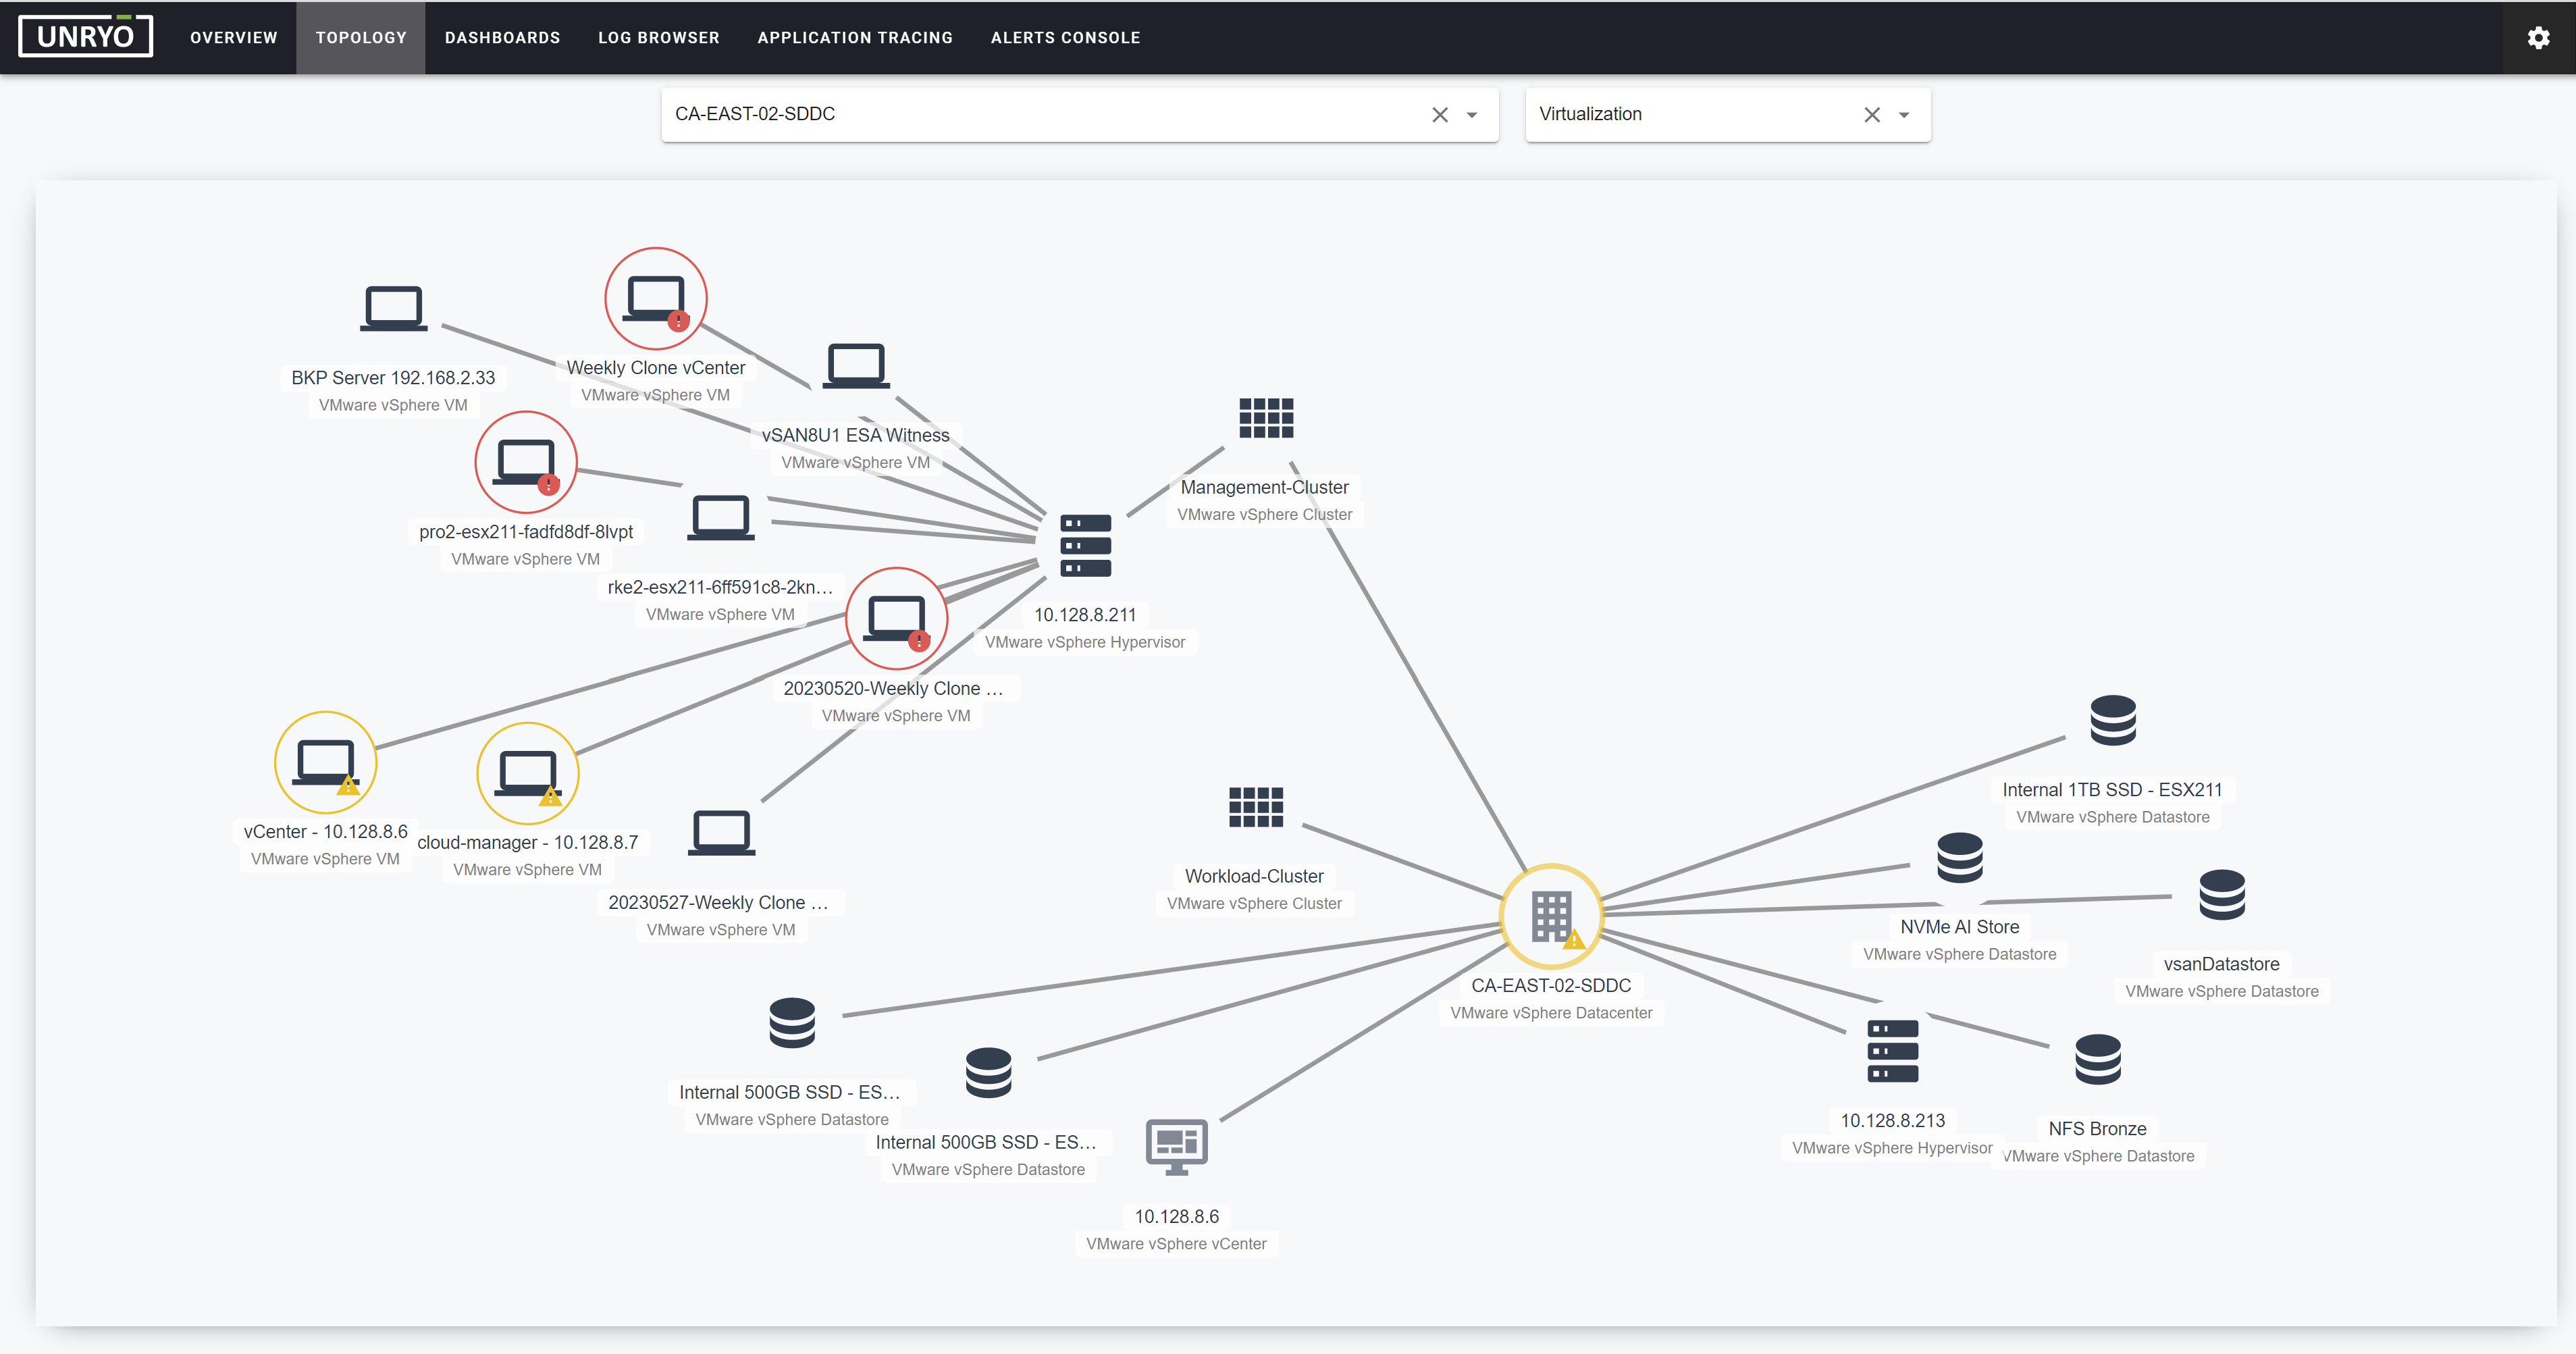
- Dynamic Map of Kubernetes Objects (nodes, pods, containers, services, deployments, ...)
- Istio (Service-to-Service Traffic)
- Correlation and RCA
- Kubernetes Dashboards
- Kubernetes Log Consolidation
- Ingestion/Mapping of Prometheus Alerts
- Kubernetes Metric Anomaly Detection
- Multi-Cluster Support
QuickStart#
Unryo needs access to your Kubernetes metrics, and to so by offering flexibility depending on your architecture.
You can have Unryo gathering Kubernetes by querying either:
- the Prometheus on your Kubernetes Cluster; or
- any other Prometheus or Prometheus-compatible endpoint that stores Kubernetes metrics (VictoriaMetrics, Thanos, Cortex, ...); or
- the Kubernetes API.
Unryo doesn't replace your Prometheus or other data source(s). Instead, it runs on top of them to do its correlation and analysis. By default, metrics are not duplicated in Unryo. However, you can configure Unryo to store important metrics for the long term if you want historical dashboards.