Kubernetes
Kubernetes#
Overview#
This page covers collecting directly from the Kubernetes API. If your cluster runs Prometheus (or you can install it), that is the strongly recommended path — see Recommended approach: connect Prometheus.
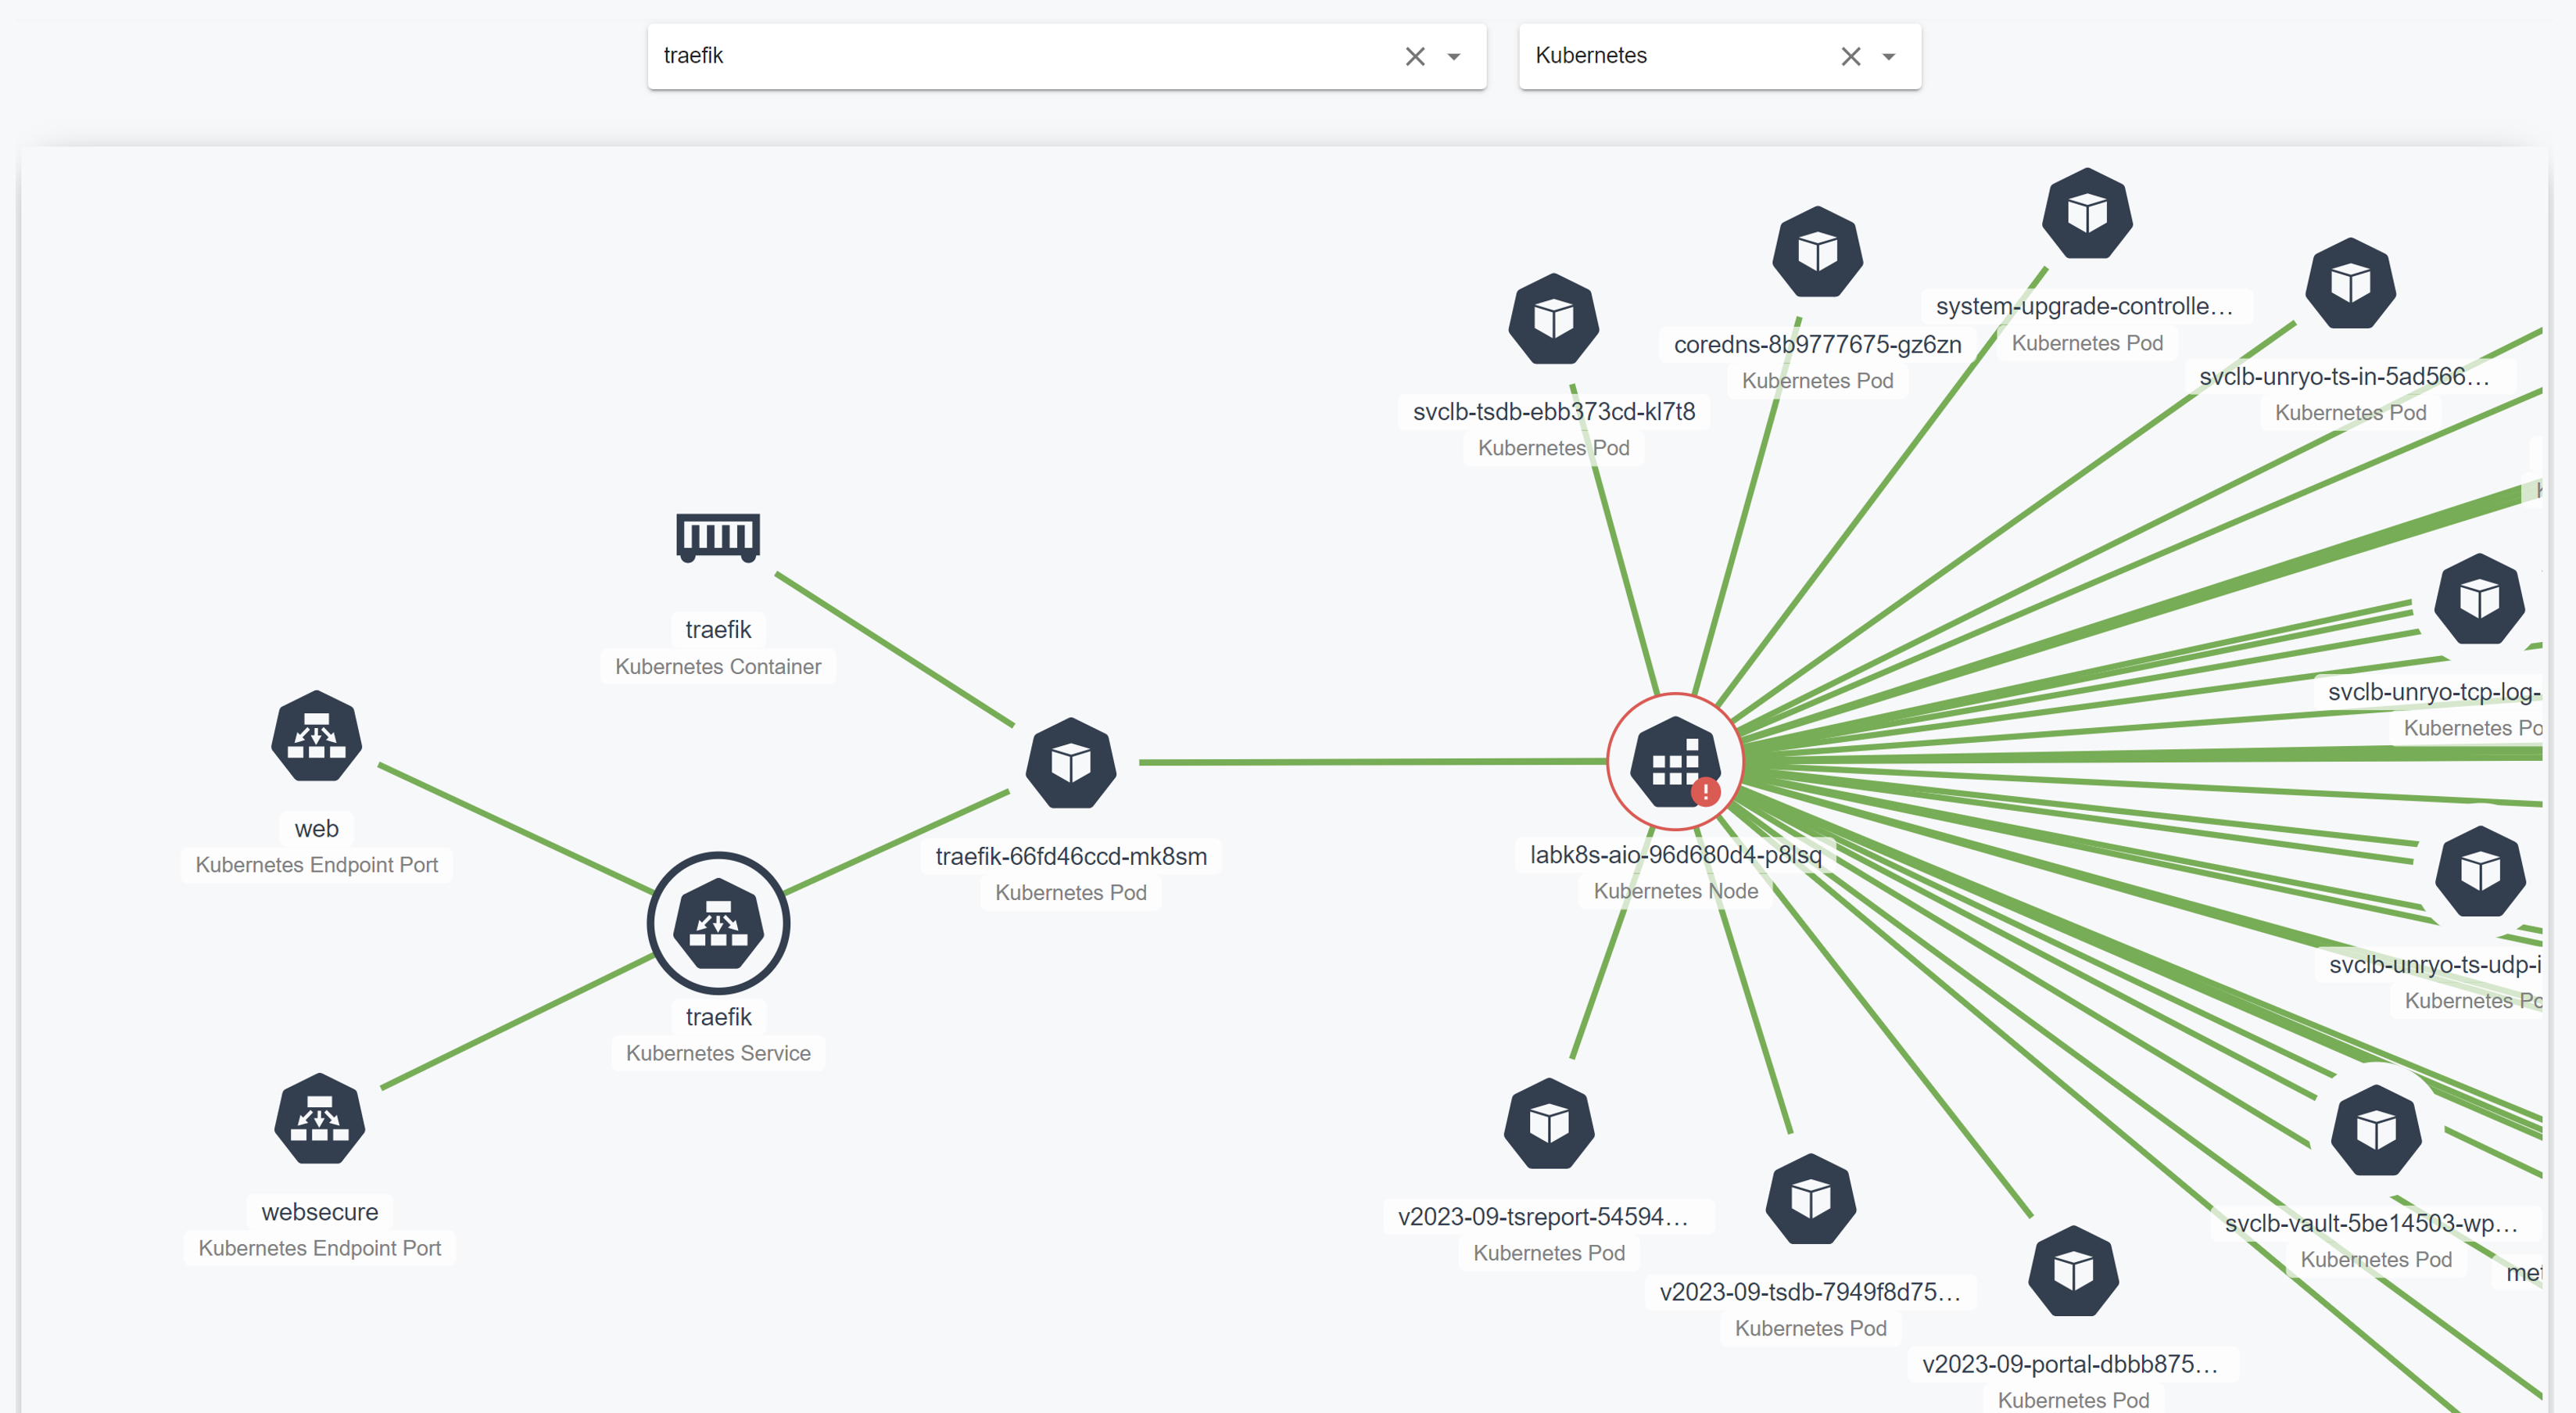
The ML Pack for Kubernetes gives visibility on all kubernetes components (nodes, runnings pods and containers, ...), in particular their status, health and topology relationships.
Prerequisites#
This page covers collecting directly from the Kubernetes API. If your cluster runs Prometheus (or you can install it), that is the strongly recommended path — see Recommended approach: connect Prometheus.
The collector uses two configuration templates:
- Kubernetes Inventory, that talks to the kubernetes API, to generate metrics derived from the state of the following Kubernetes resources (daemonsets, deployments, endpoints,ingress,nodes, persistentvolumes, persistentvolumeclaims, pods (containers), services,statefulsets, resourcequotas, ...)
- Kubernetes, that talks to the kubelet API using the /stats/summary endpoint to gather metrics about the running pods and containers for a single host. It is assumed that this plugin is running as part of a daemonset within a kubernetes installation. This means that the collector is running on every node within the cluster. Therefore, you should configure this collector to talk to its locally running kubelet.
Access requirements: the collector needs read access to the Kubernetes API (pods, nodes, services, endpoints, deployments, daemonsets, statefulsets, persistentvolumes, persistentvolumeclaims, ingresses). When you deploy the Unryo Collector inside the cluster with the Unryo Helm chart, the required ServiceAccount, ClusterRole, and ClusterRoleBinding are created for you — controlled by k8sMonitoringPermissions (enabled by default; see Kubernetes Deployment). For a collector running outside the cluster, provide a kubeconfig or ServiceAccount token with the same read access.
Per-node metrics: the Kubernetes Inventory template runs from a single collector (one cluster-wide API query). The Kubernetes (kubelet) template, by contrast, needs one collector instance per node — i.e. the collector deployed as a DaemonSet — which the standard Unryo chart does not ship. For full per-node coverage, prefer the Prometheus approach, whose node-exporter already handles per-node collection.
Configuration#
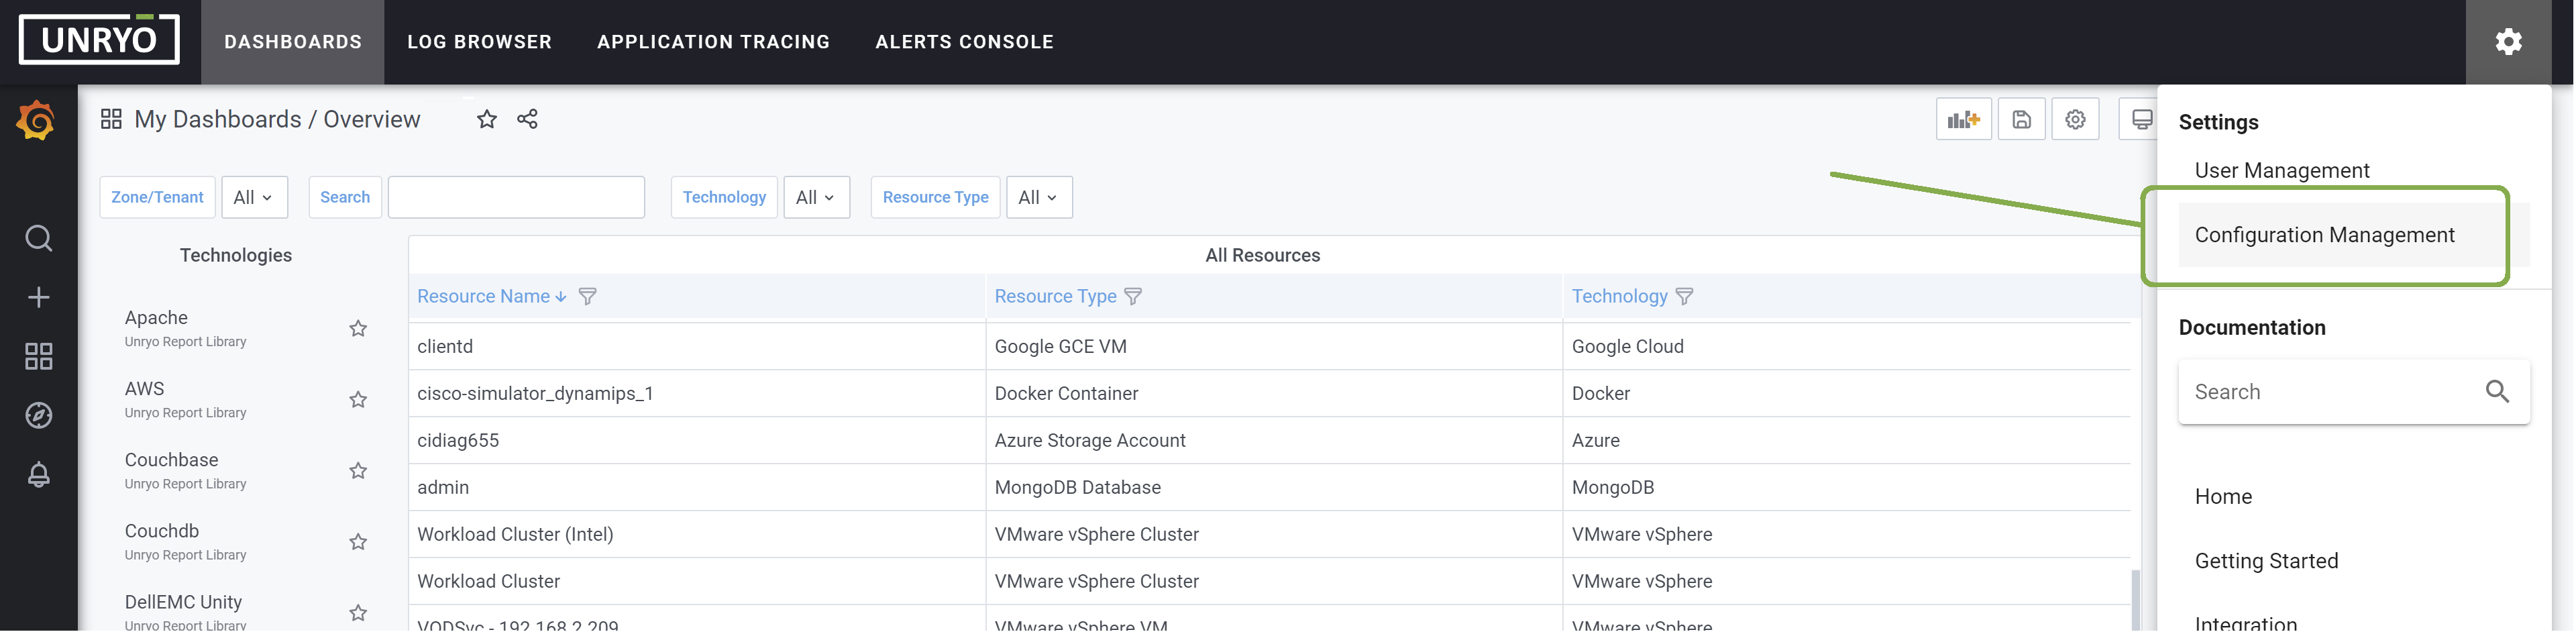
Go in Configuration Management.
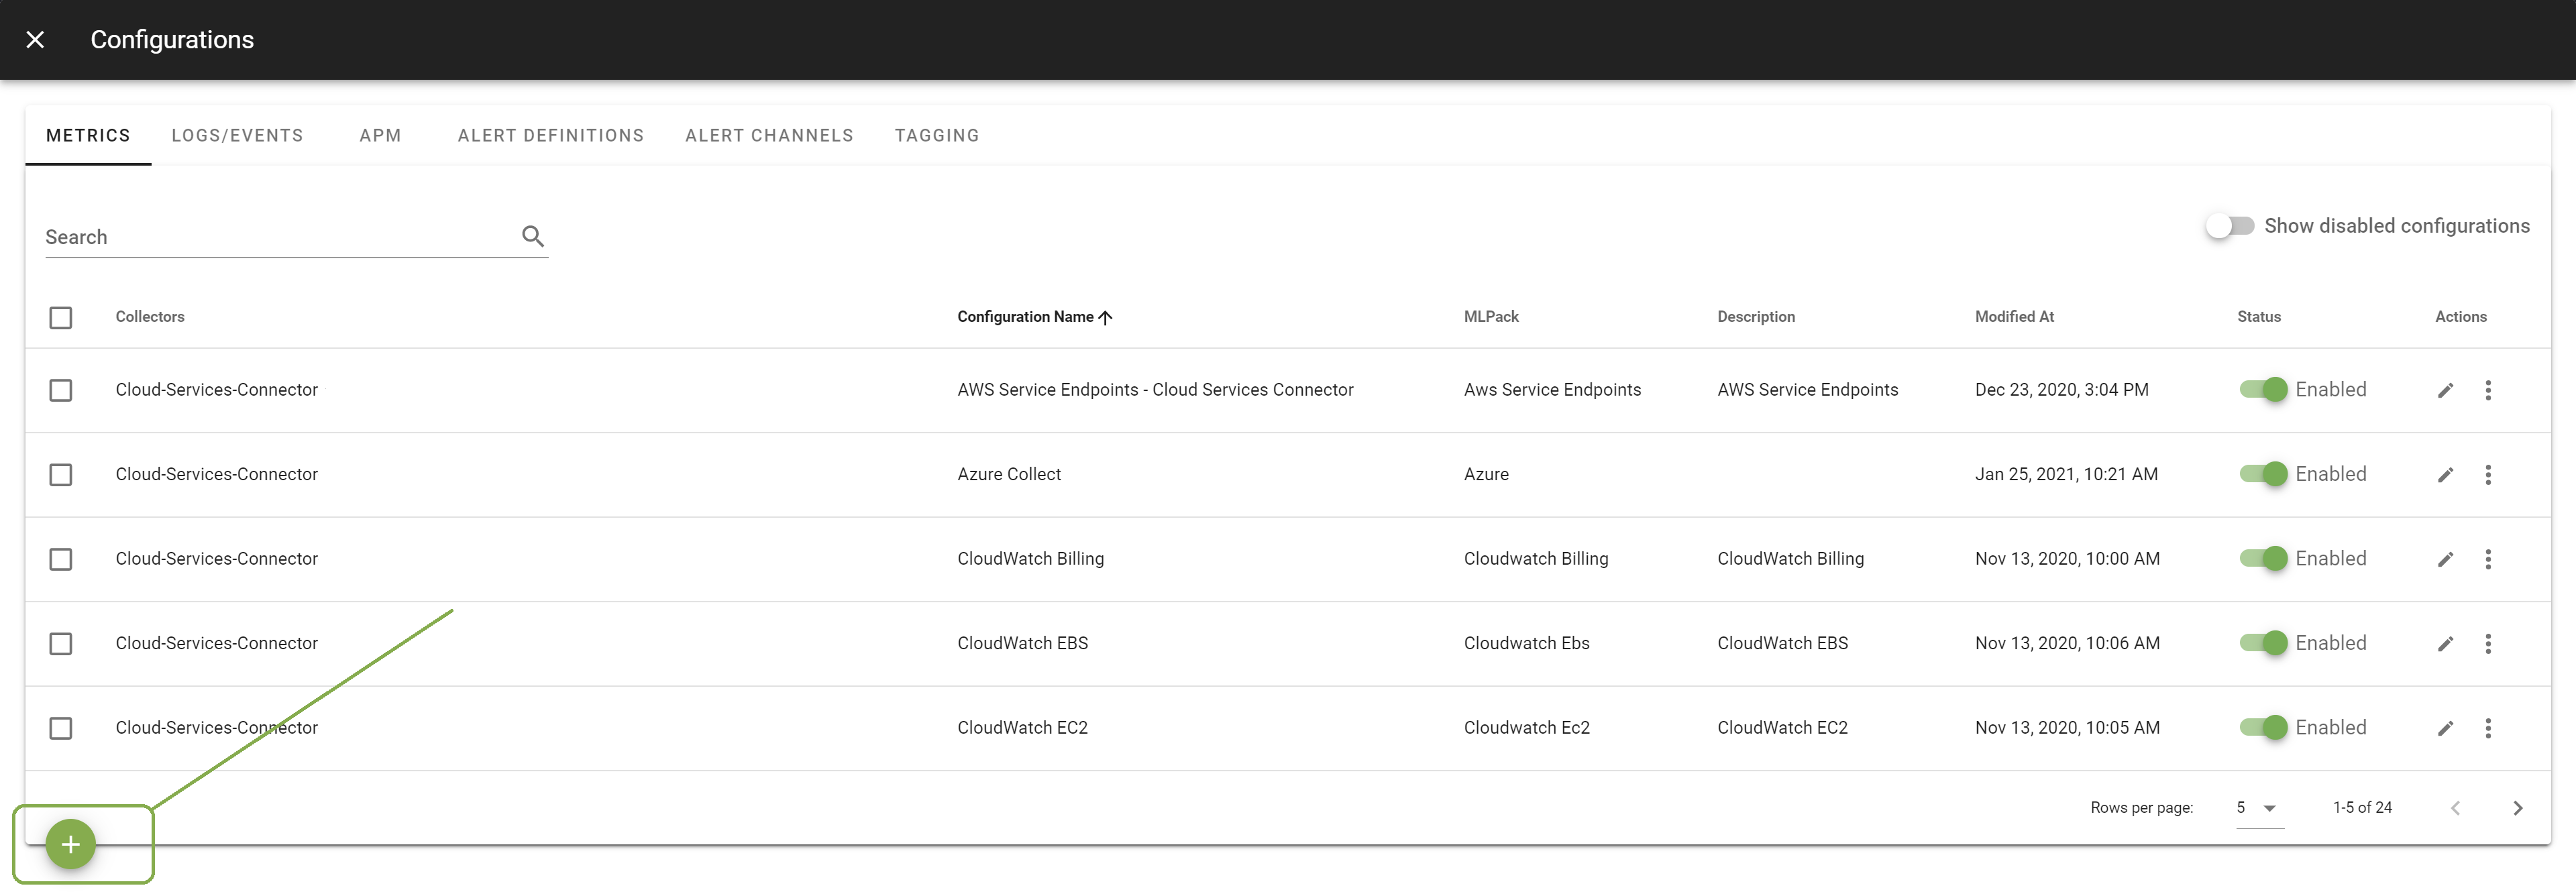
Click on the + button to add a new configuration.
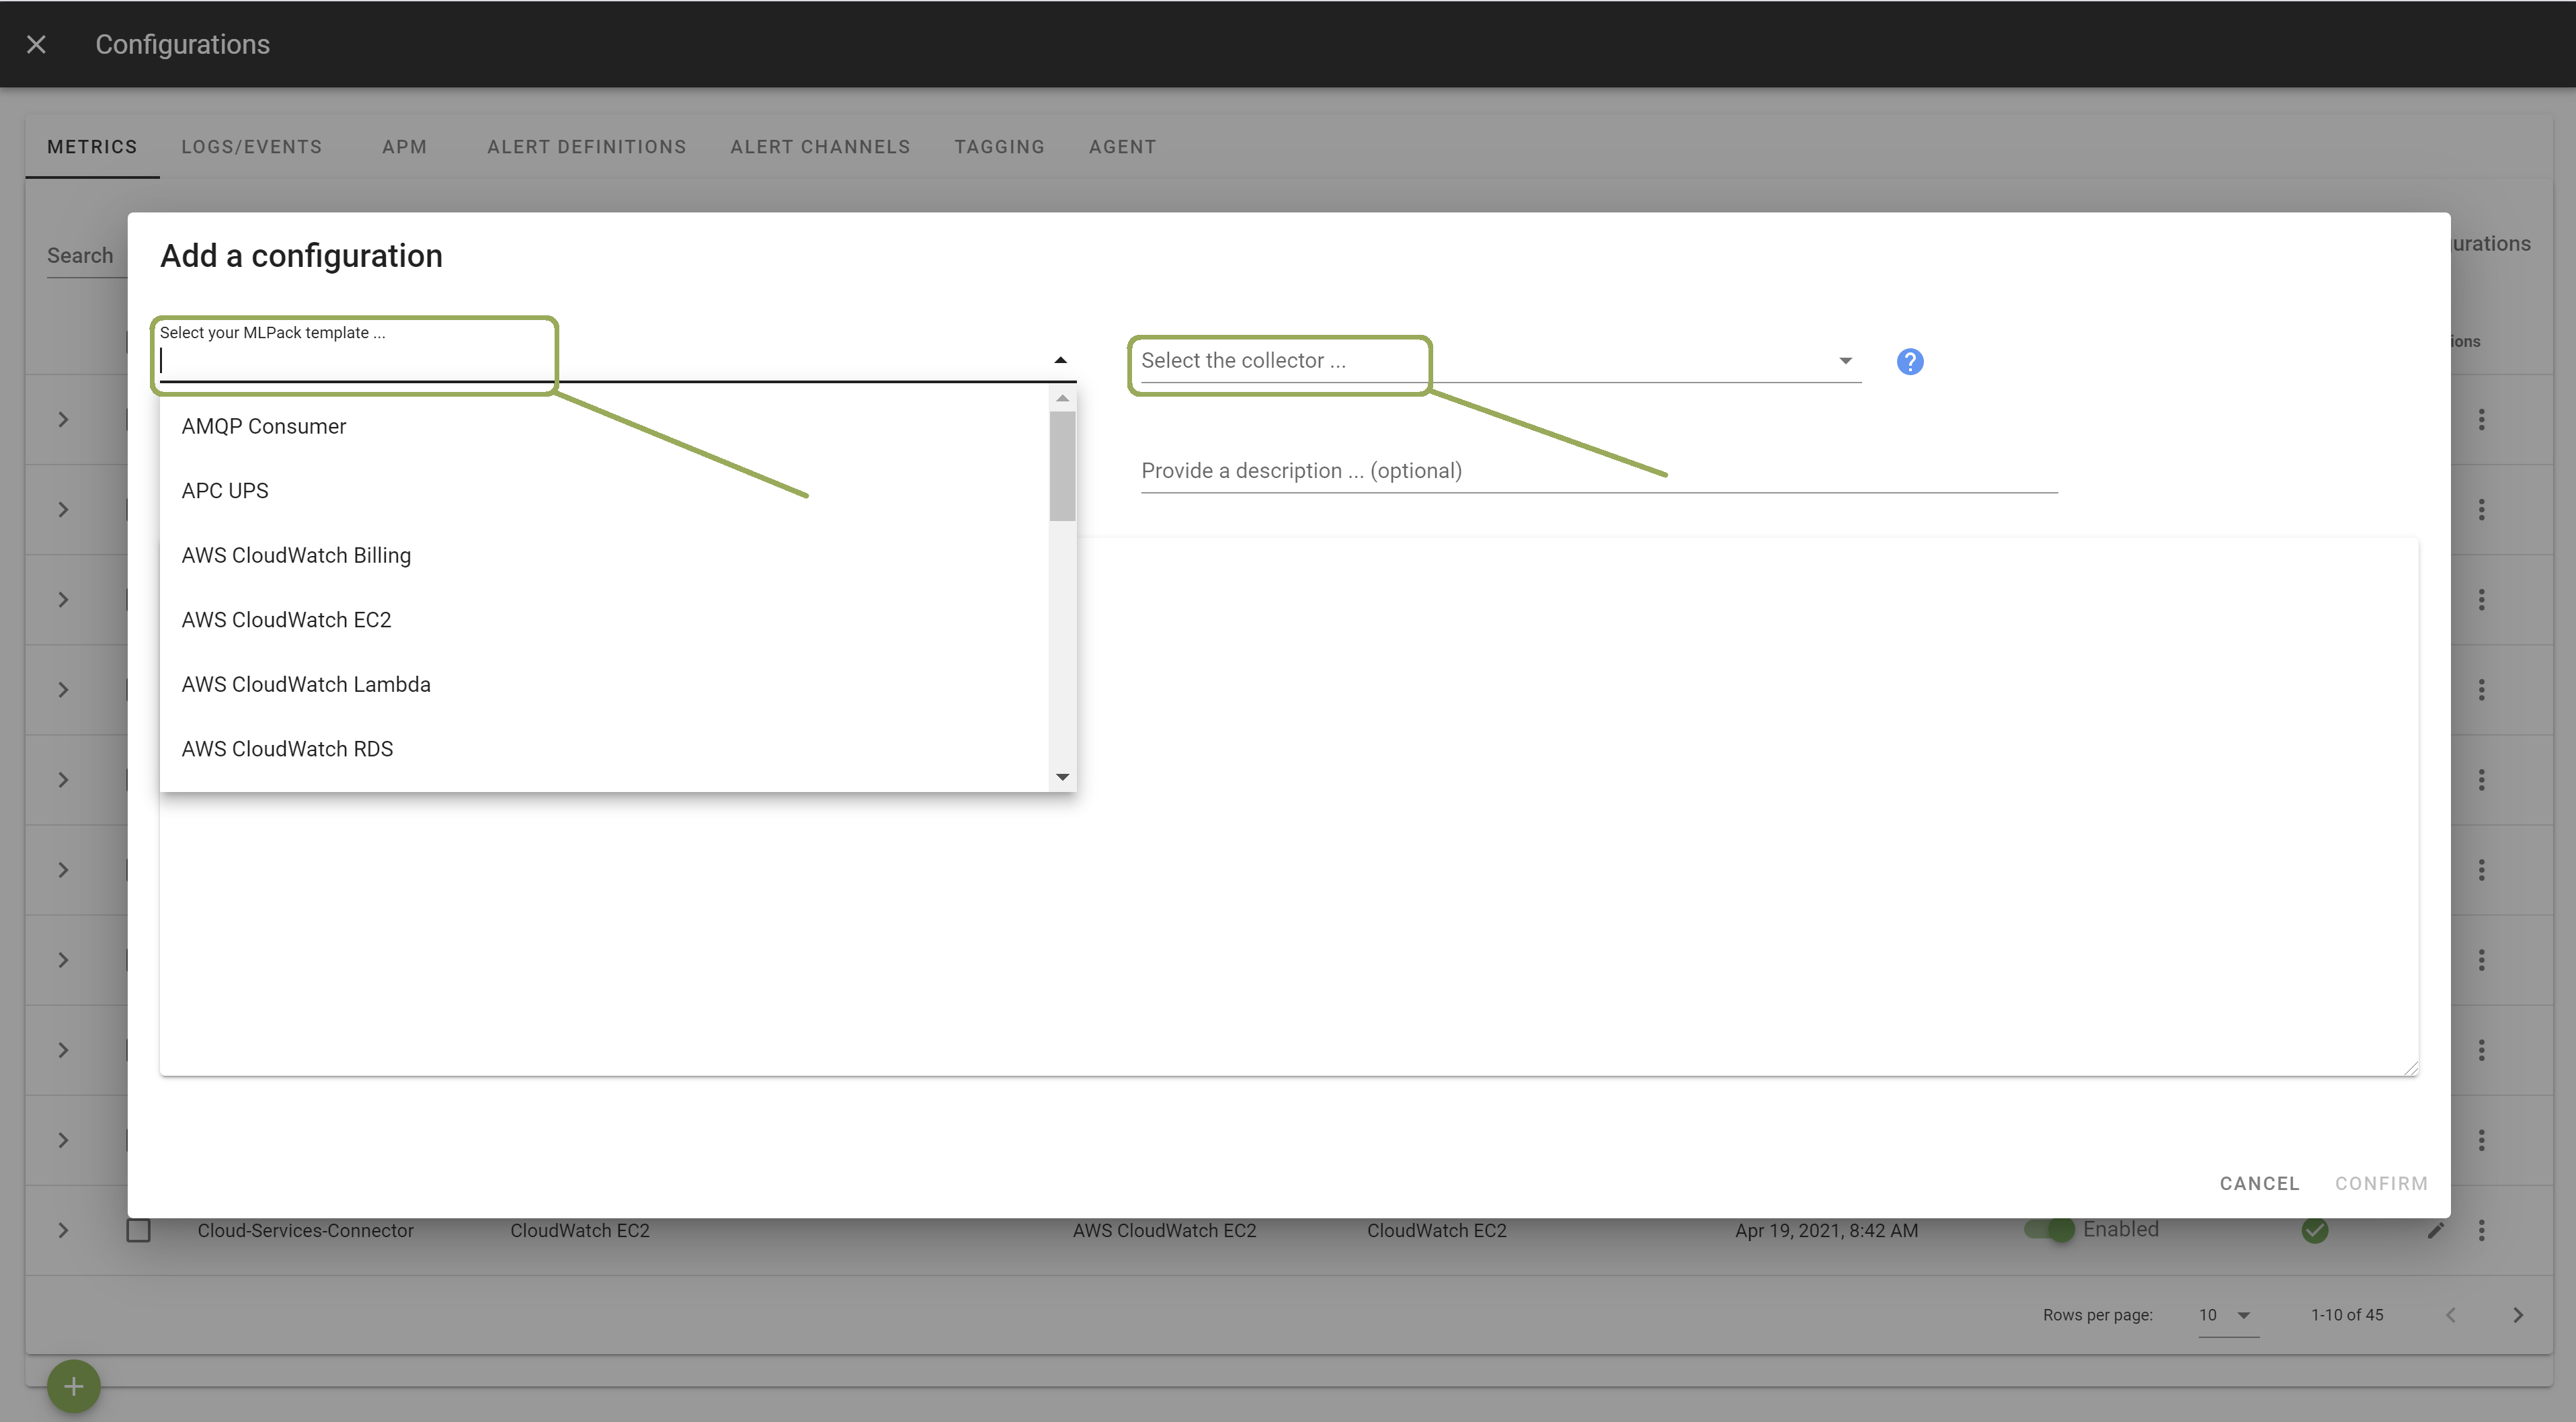
Select the templates Kubernetes and Kubernetes Inventory. Select the Collector on which you want this configuration to be deployed; and provide a Configuration Name that is meaningful for you. The Description is optional.
In the template, enter the correct settings for your Kubernetes instance(s). Other configuration options are possible. Browse the template to discover them.
Once done, click Apply to start the monitoring.
Metrics#
- Kubernetes Cluster
- Kubernetes Service
- Kubernetes Deployment
- Kubernetes Daemonset
- Kubernetes Endpoint
- Kubernetes Node
- Kubernetes Pod Container
- Kubernetes Pod Volume
- Kubernetes Pod Network
See Also#
-
Kubernetes Events : This integration retrieves Kubernetes events from one or multiple clusters, providing you a central place to watch them in real-time.
-
Kubernetes Energy : Kepler (Kubernetes Efficient Power Level Exporter) is a system that exposes a variety of metrics about the energy consumption of Kubernetes components such as Pods and Nodes.