Alerts Console#
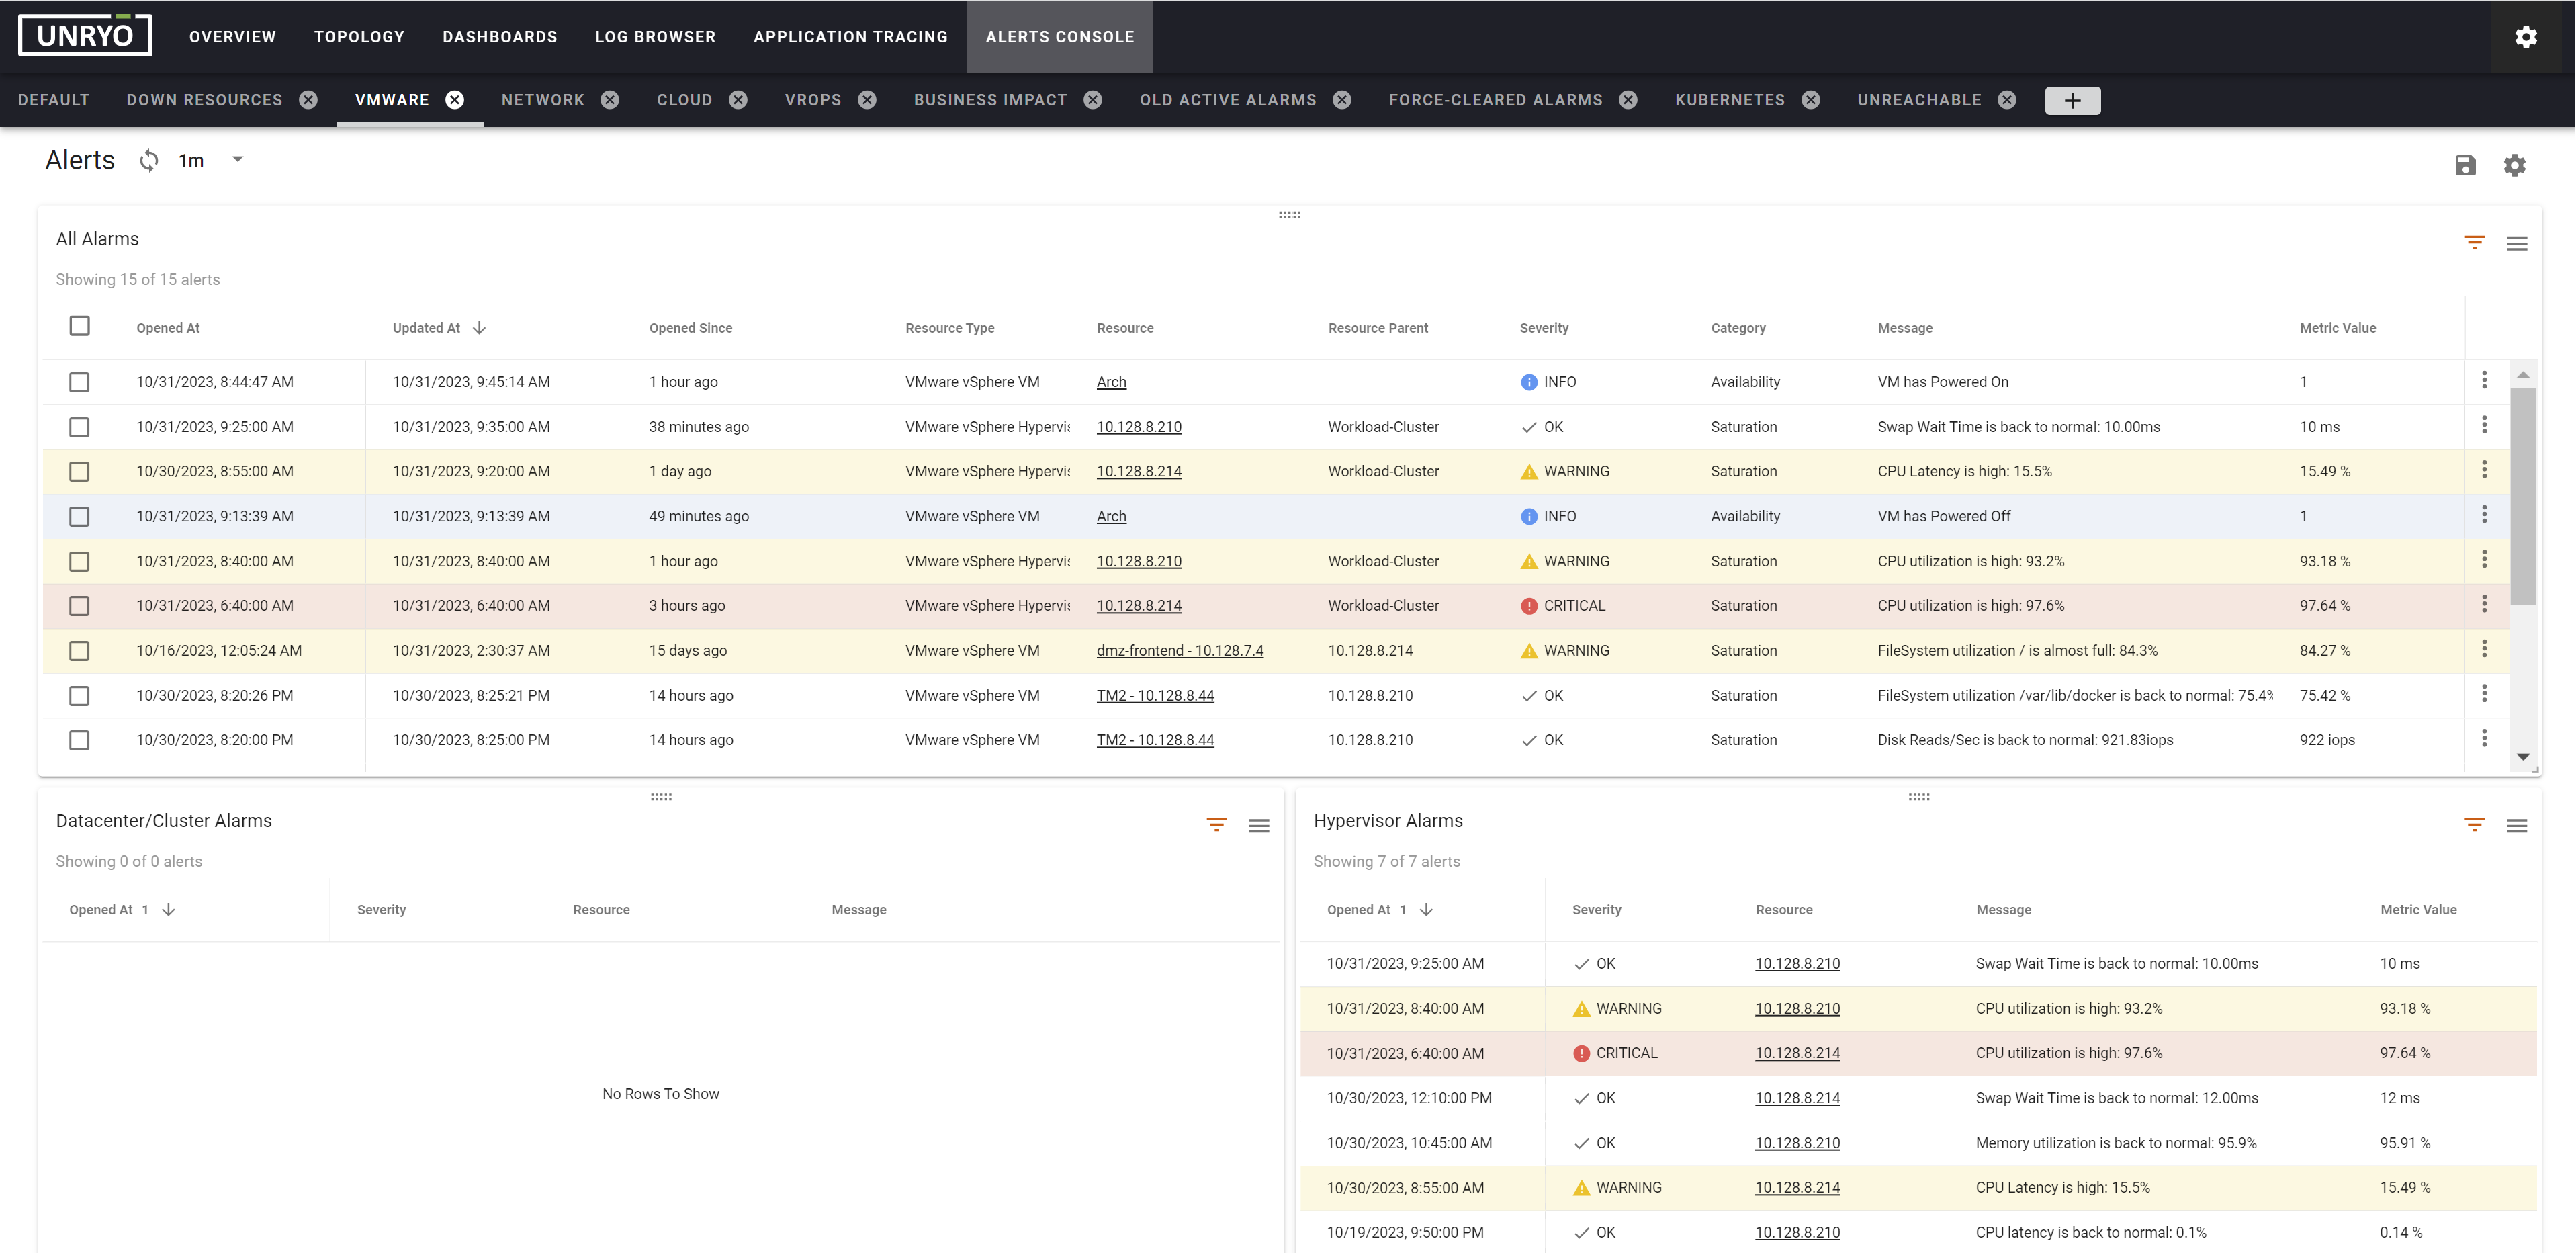
The Alerts Console shows all active and past alerts in your organization. It can be customized, per user, to show information relevant to them.

Use the Alert Console#
Possible actions on alerts:
| Action | Description |
|---|---|
| Alert Details | Shows information such as alert occurrences, tags, ChatGPT recommendations, alert policy information, resource information, etc. |
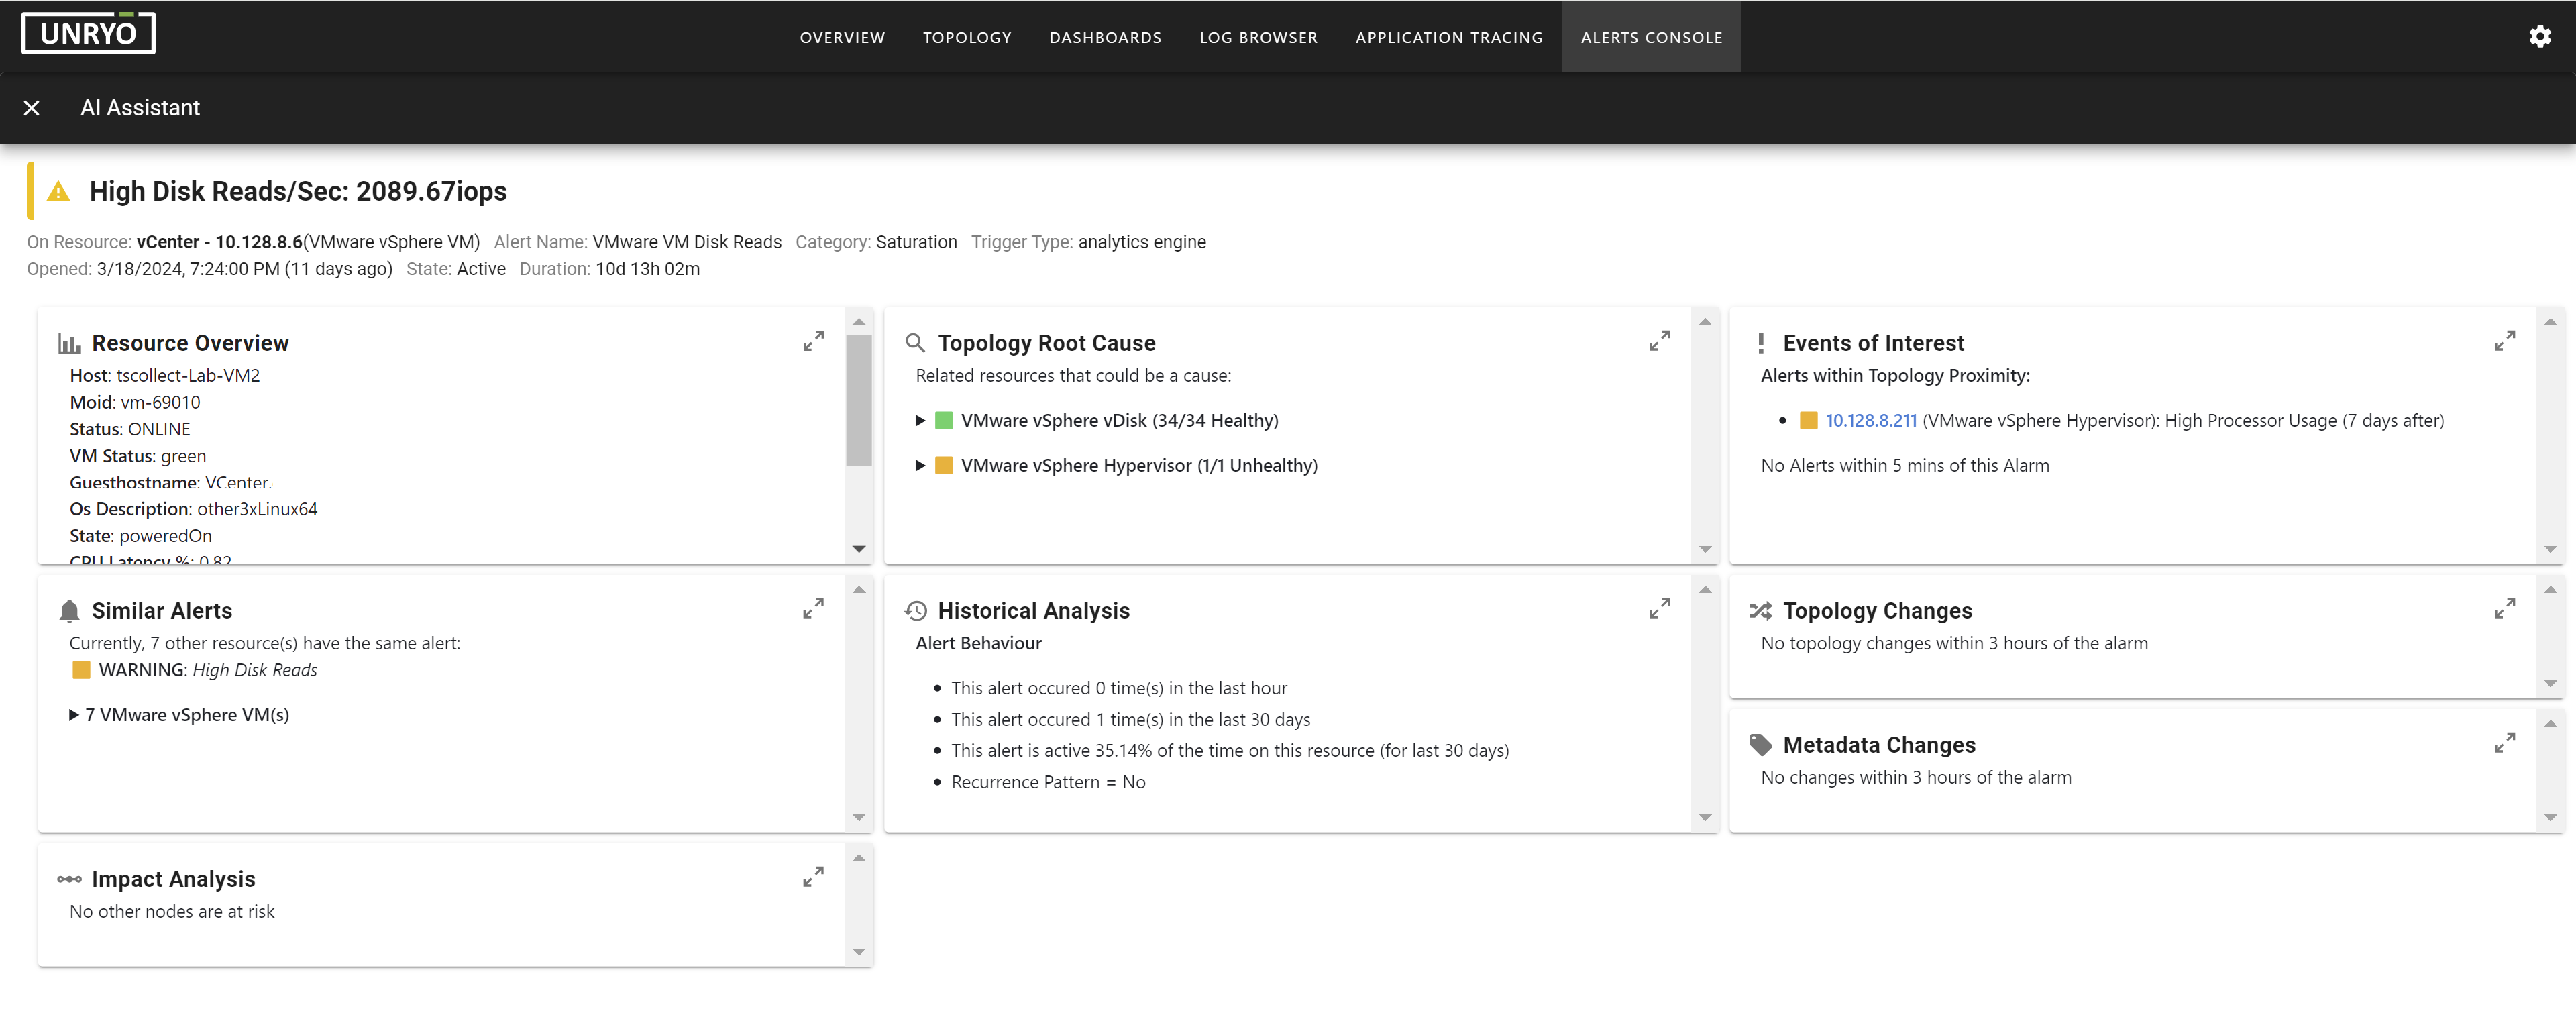
| AI Assistant | Displays the AI Assistant panel, which provides insights to help resolve the problem. |
| Click on a resource | To access the dashboard or topology map |
| Acknowledge/Unacknowledge | To Acknowledge or Unacknowledge an alert. |
| Take Ownership/Release Ownership | To advise your team you are working on it. |
| Force Clear | Force clear an alert. Forcibly cleared alerts are slightly different than naturally cleared alerts. They will stay cleared for the remainder of a specific occurrence while naturally cleared alerts will change back to being active on any re-notification. |
| Tools | Invoke a tool on the alarm for troubleshooting or repair. |
Customize the Alerts Console#
The Alerts Console is customizable per user.
- To add a tab, select
+from the tab bar. - To add a panel, select
Add Panelfrom the gear menu. - To select columns to display, select
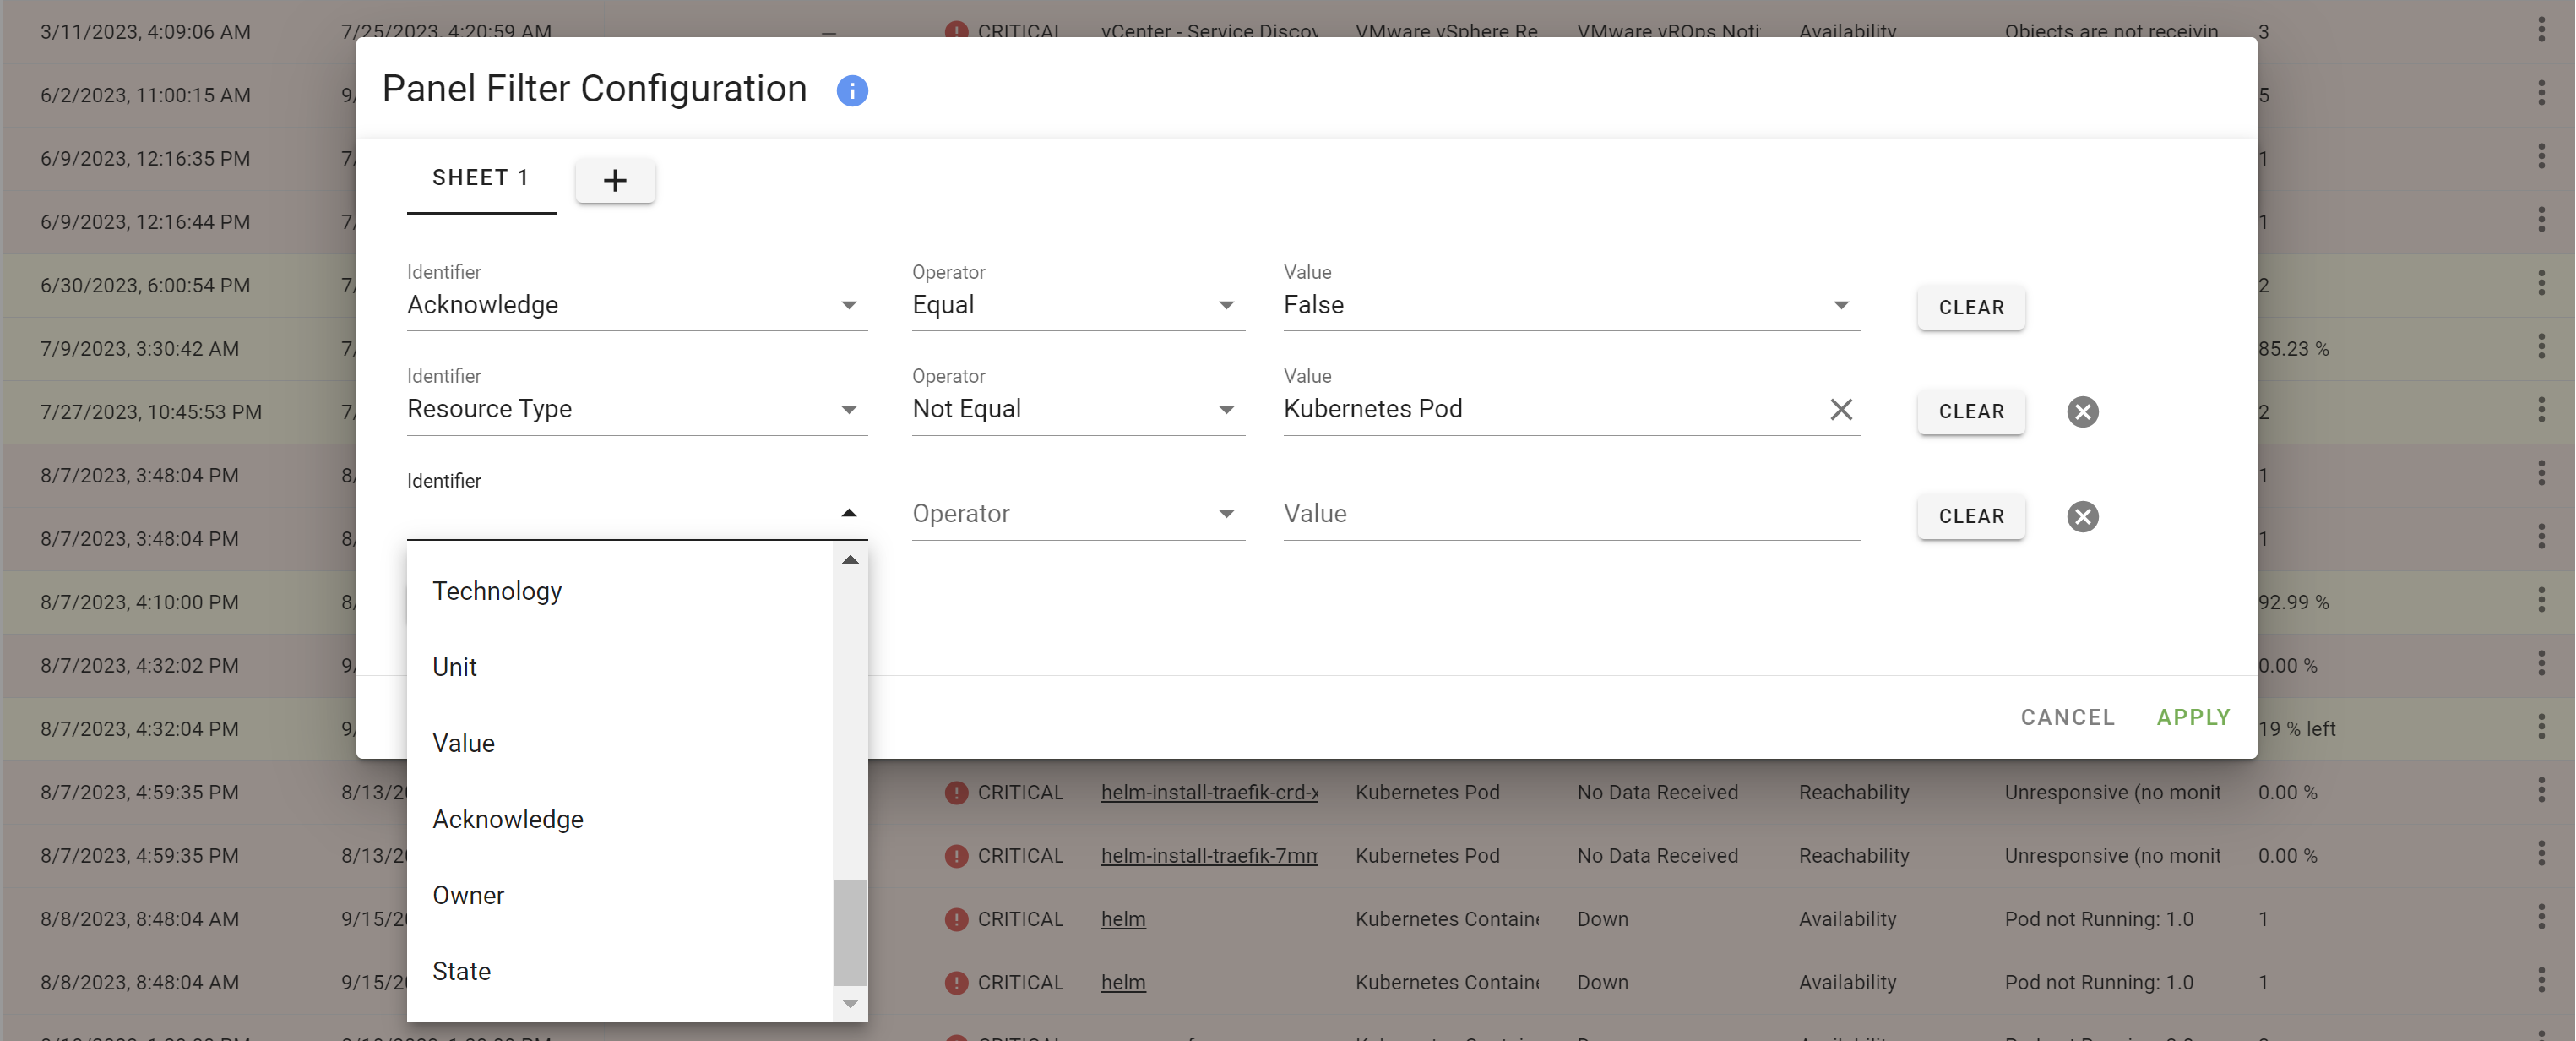
Configurationfrom the panel's menu. - To filter alerts, select
Manager Filterfrom the panel's menu. - To remove a panel, select
Removefrom the panel's menu.

Copy a Customized Console to other users#
- Inside the Alerts container, find the user's dashboards you want to copy from in
/etc/unryo/alerts/dashboard. You can do this simply by making a small change to the dashboards, saving it and then checking the latest update times. - In the same place and using the same method, find the user(s) dashboards you want to copy to.
- Once both are located, simply copy the content of the first file to the other(s). They should now have the same dashboards configuration.
Invoke the AI Assistant#
The AI assistant offloads your operation teams by automating the investigation work.
It summarizes, in one view, the situation around the selected alert: all the necessary information, why the alert triggered, the context around it, the correlation results, and prepare troubleshooting steps for the user.
The AI assistant view is dynamic, meaning the information presented is in context to the alarm type or to the domain monitored.

Tools#
A tool is an executable you can invoke on alarms, for example ping a resource, run a specialized check or integrate with an incident system. When a tool is invoked, it gets all the metatada associated to the alarm.
-
To run a tool: click the 3 dots icon (right to the alarm) and select Tools.
-
To add a tool: inside the Alerts container, copy your executable in
/etc/unryo/tools. These executables are typically shell scripts that can either execute any number of commands or call binaries. These scripts contains "headers" comments that will be parsed by our backend for information and directives. These are the available headers with some example values:#ACTION_OUTPUT: indicates that the tool will return information and therefore its output will be captured and shown to the user.#ACTION_NAME=Cloud Provider Status: is the tool's name.#ACTION_FILTER={"groups":[{"predicates":[{"identifier":"technology","operator":"=","value":"Azure"}]},{"predicates":[{"identifier":"technology","operator":"=","value":"Google Cloud"}]}]}: is a filter that will be applied on the alerts so that the tool is only available and ran on these alerts. It uses the same syntax as the alerts console's panel filters.
For tools that will output, a priority score should be set so that the AI Assistant order them appropriately. This score is added to the tool's output in the following form:
#PRIORITY_SCORE=VALUEwhereVALUEcan be any number greater than or equal to 0. Note that a priority of 0 will hide the widget from the AI Assistant window. Now that everything is properly set, the tools should be available in the console, under the actions button or in the top right of a panel when selecting alerts.
Tools are executed from the Alerts Container.