Visualize your Infrastructure#
Unryo provides an interactive portal to visualize, search, and analyze your infrastructure and services.
From a single place, users can:
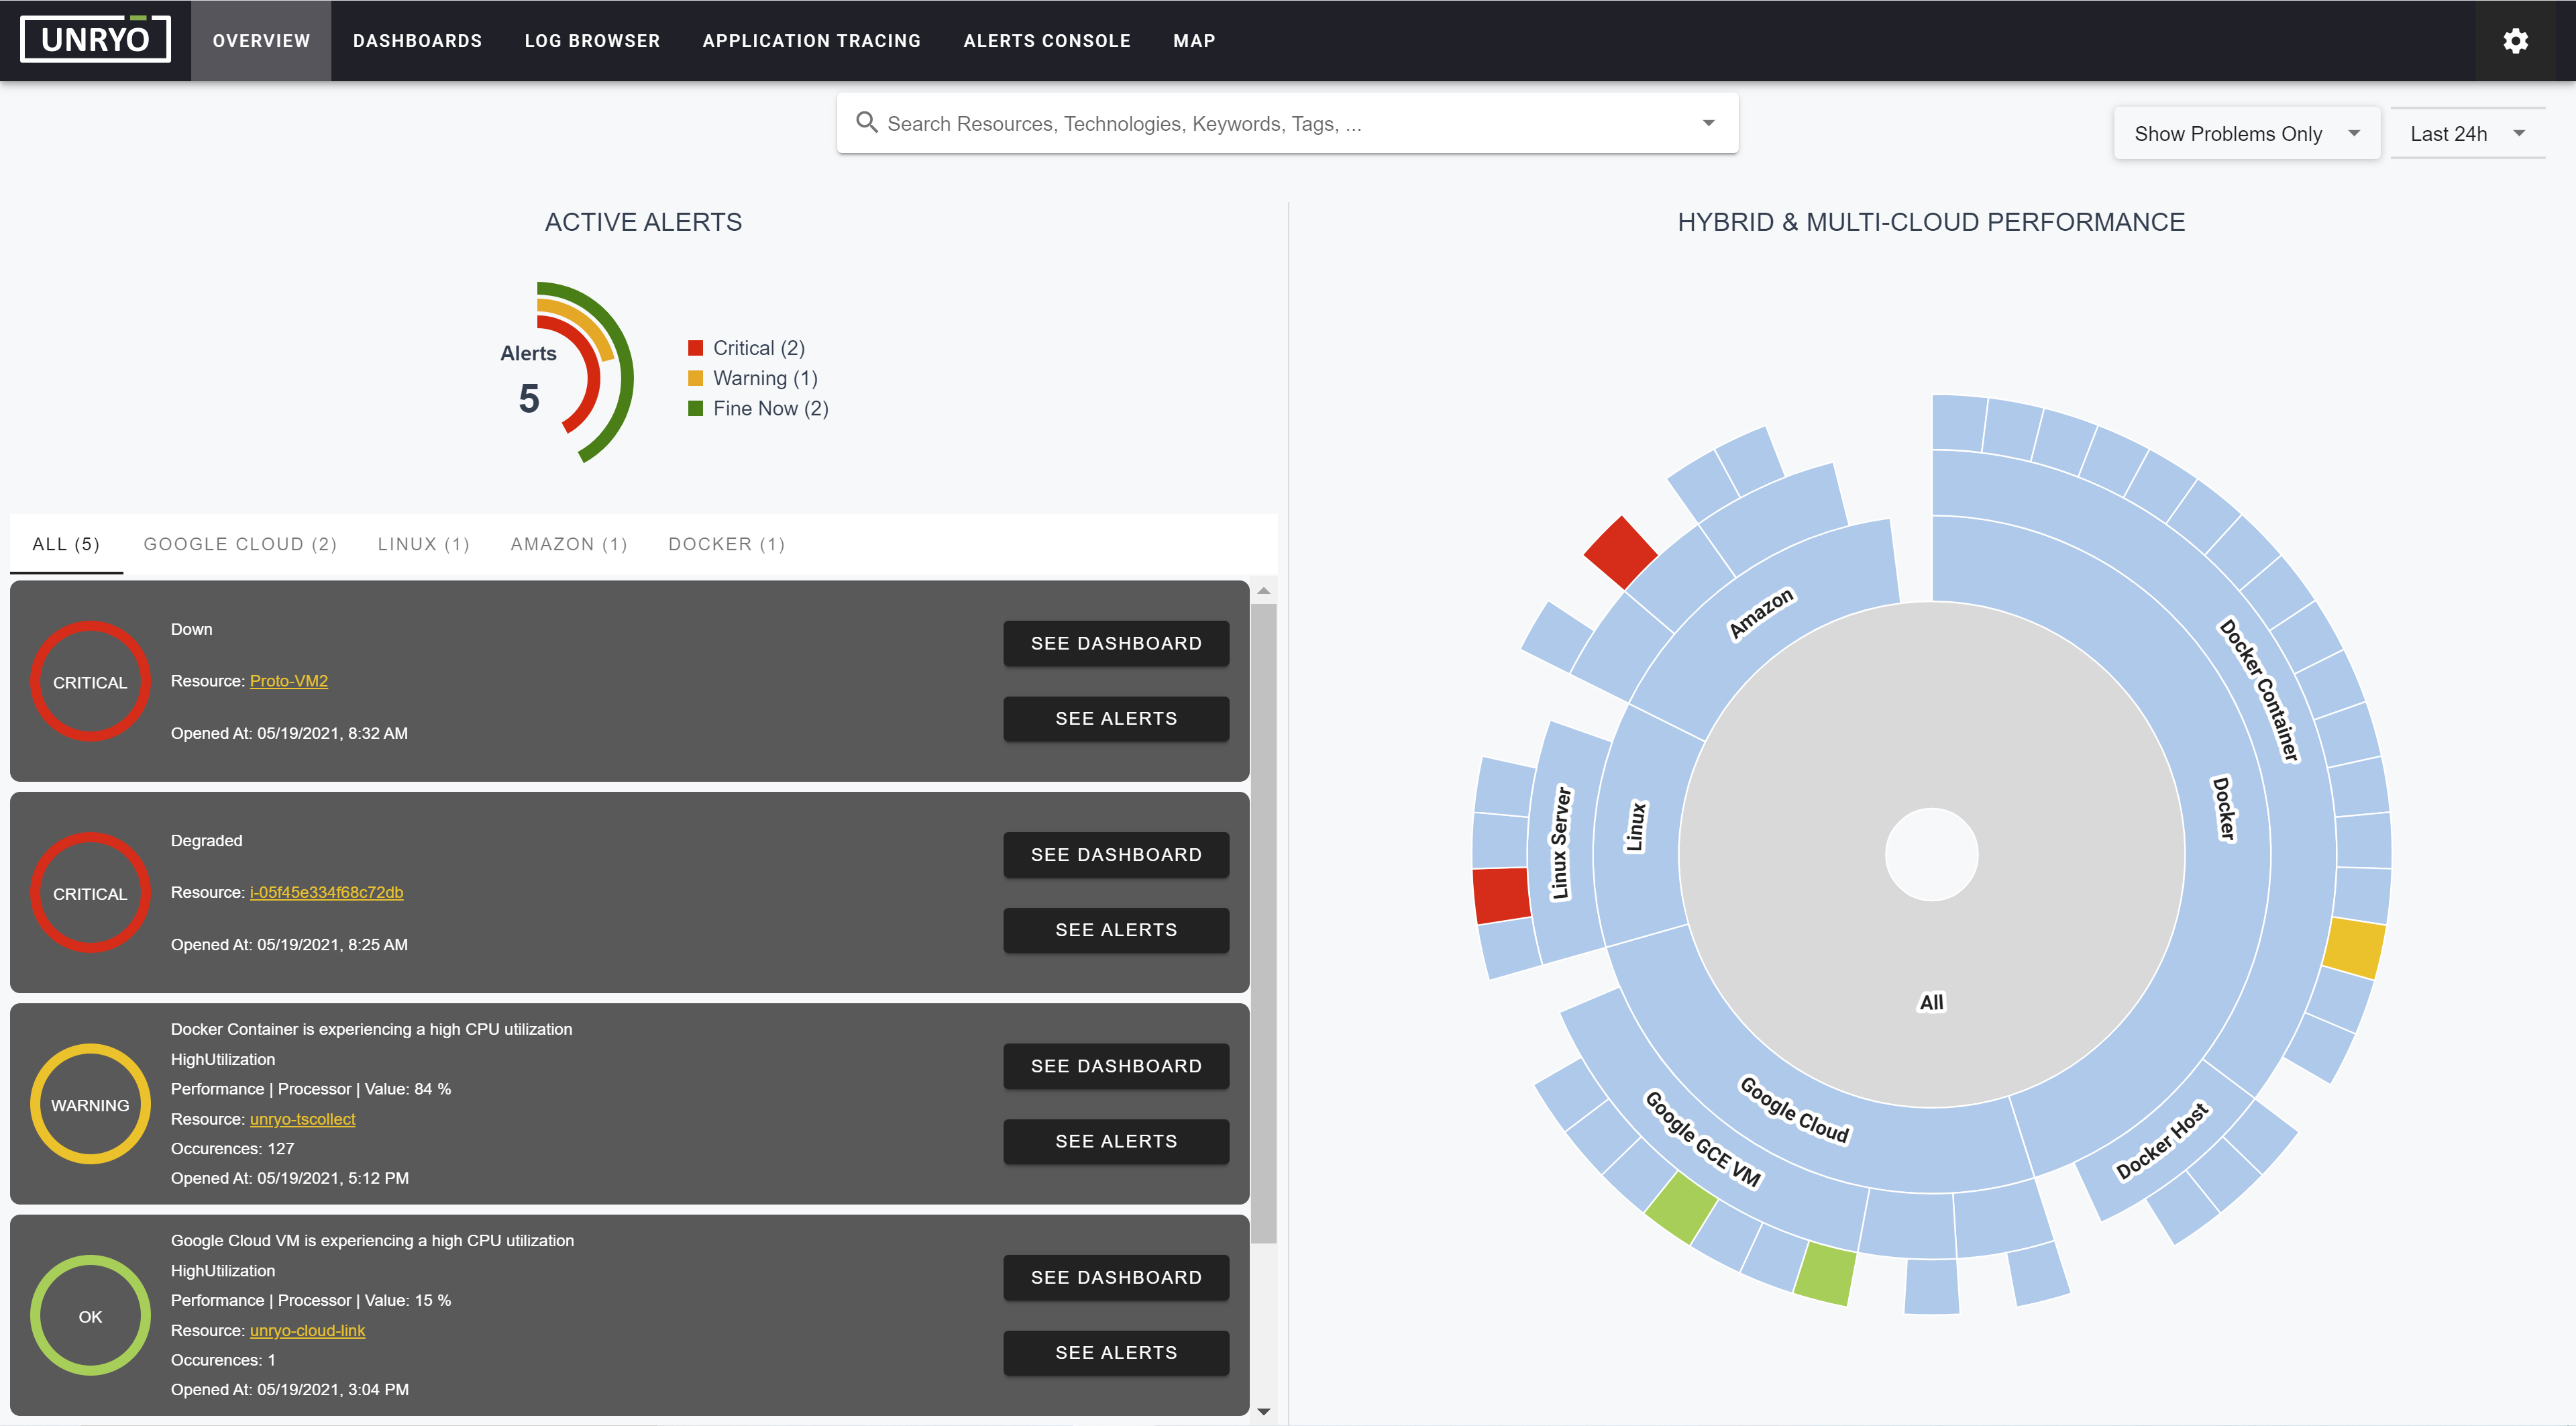
Go in Overview to see the overall state of the infrastructure, in real-time.
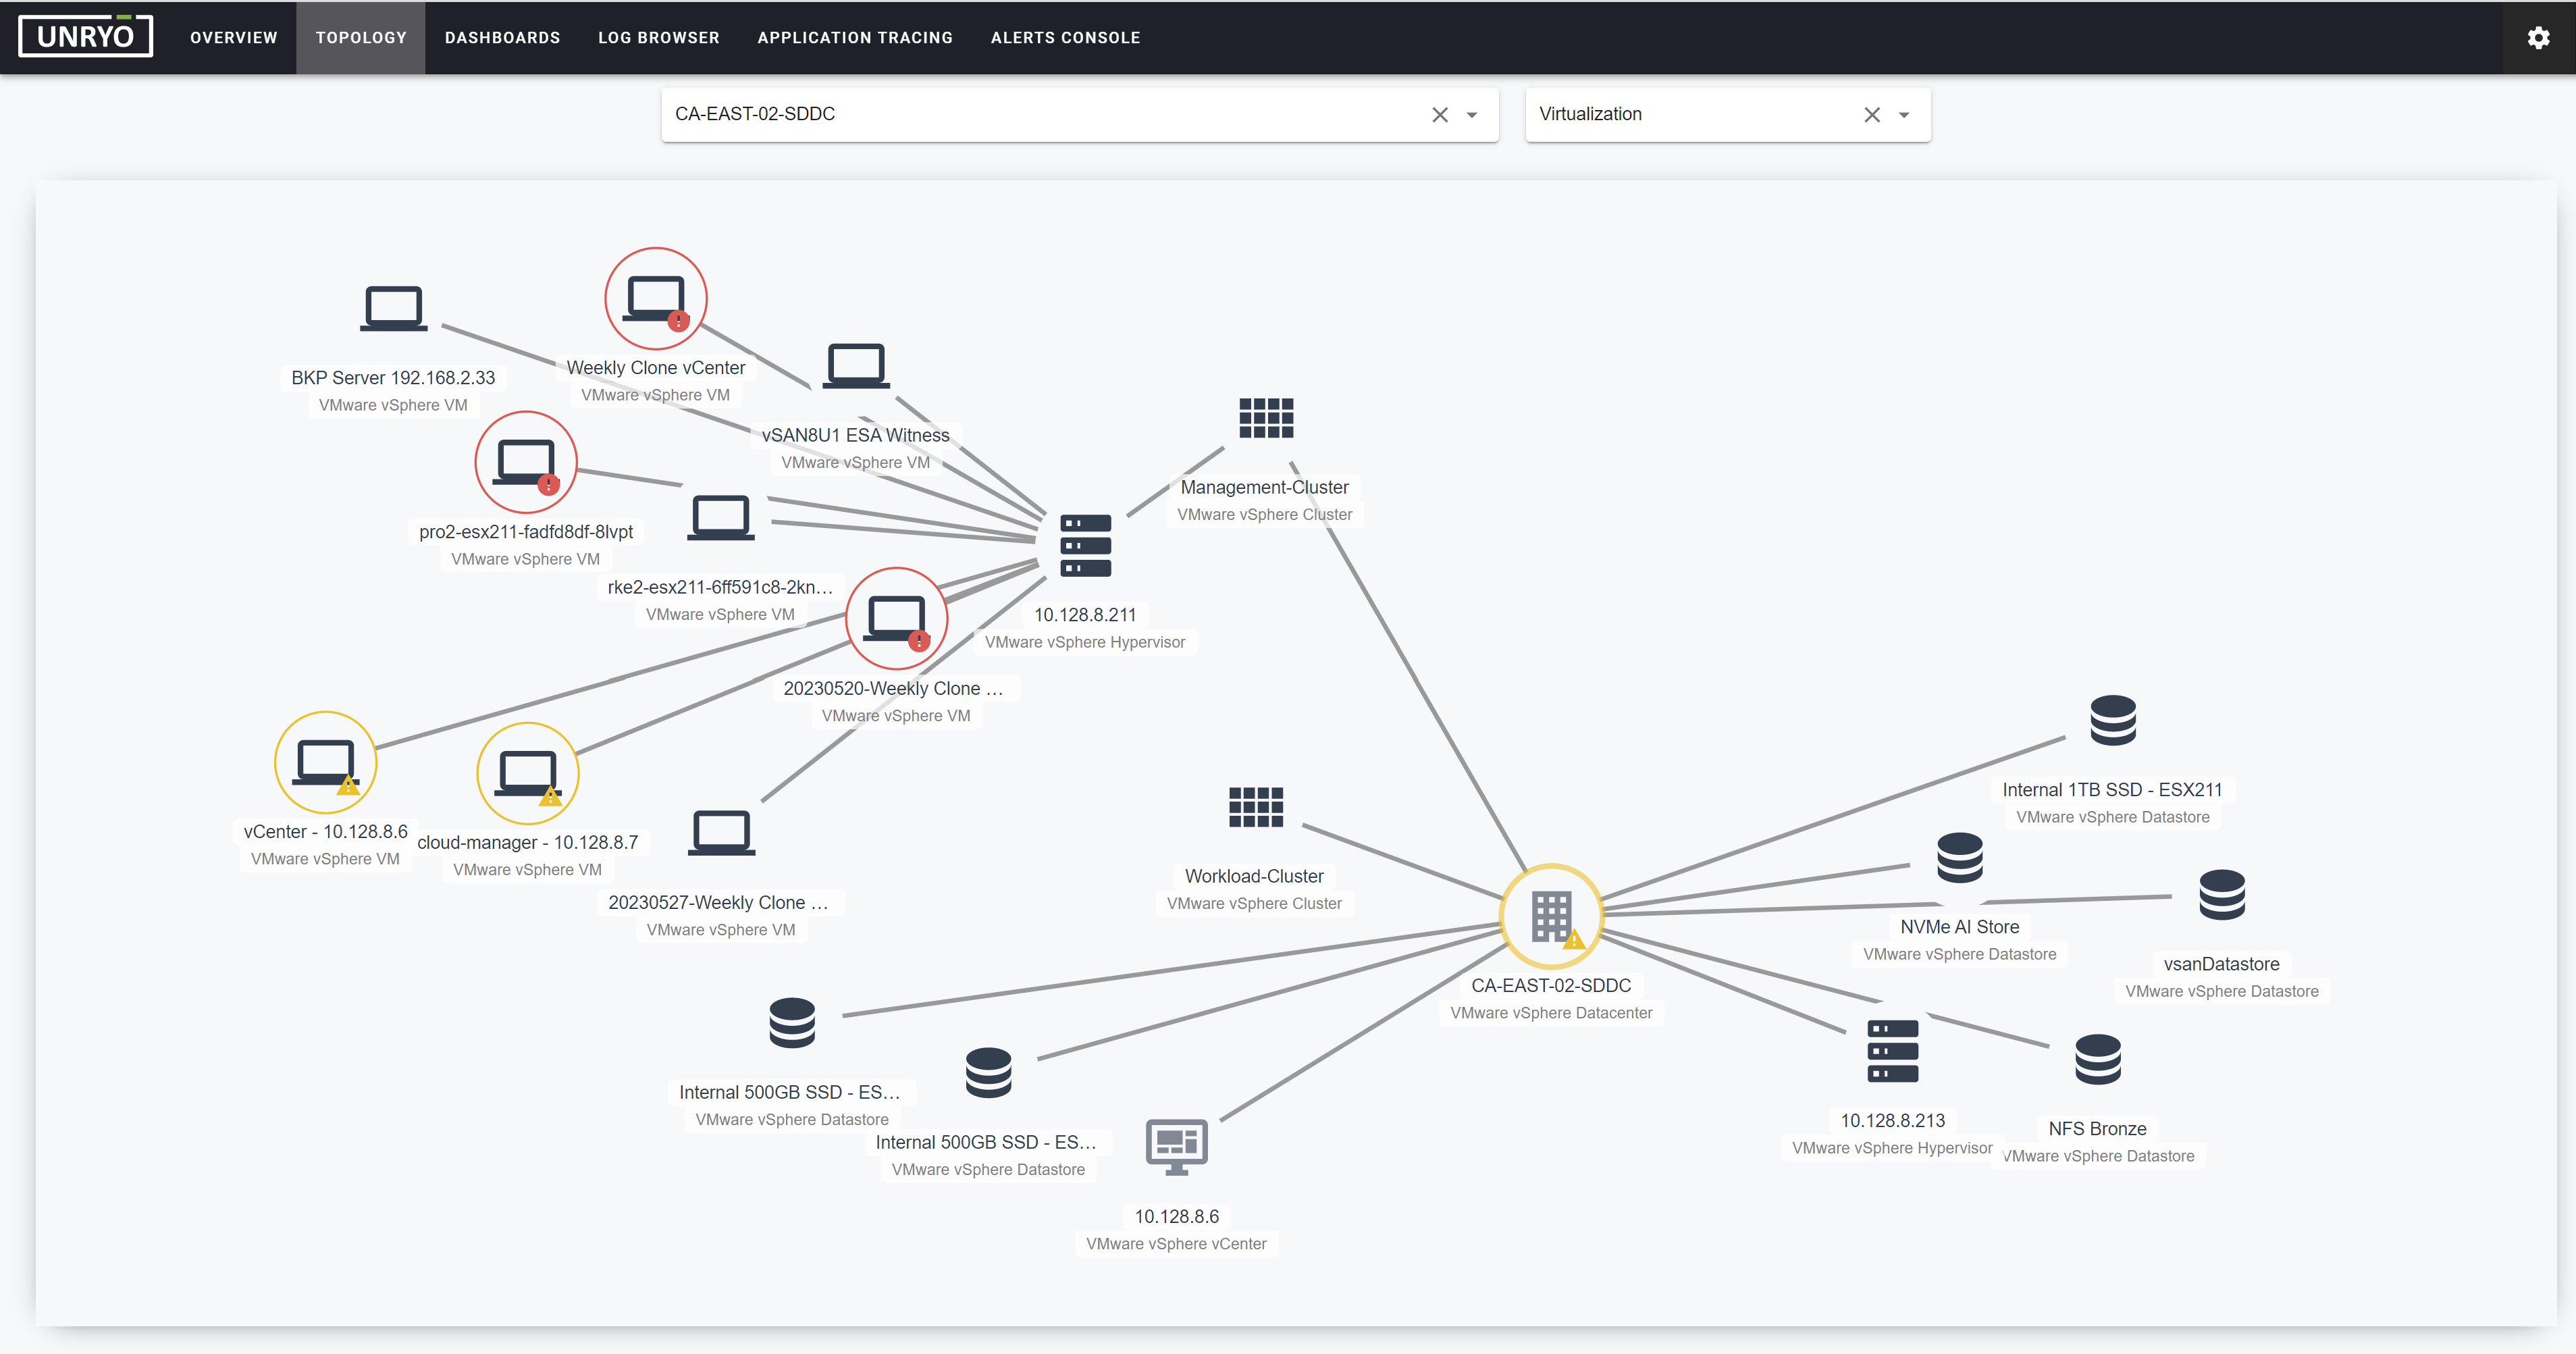
Go in Topology Map to visualize the infrastructure across multiple topology layers, and over time.
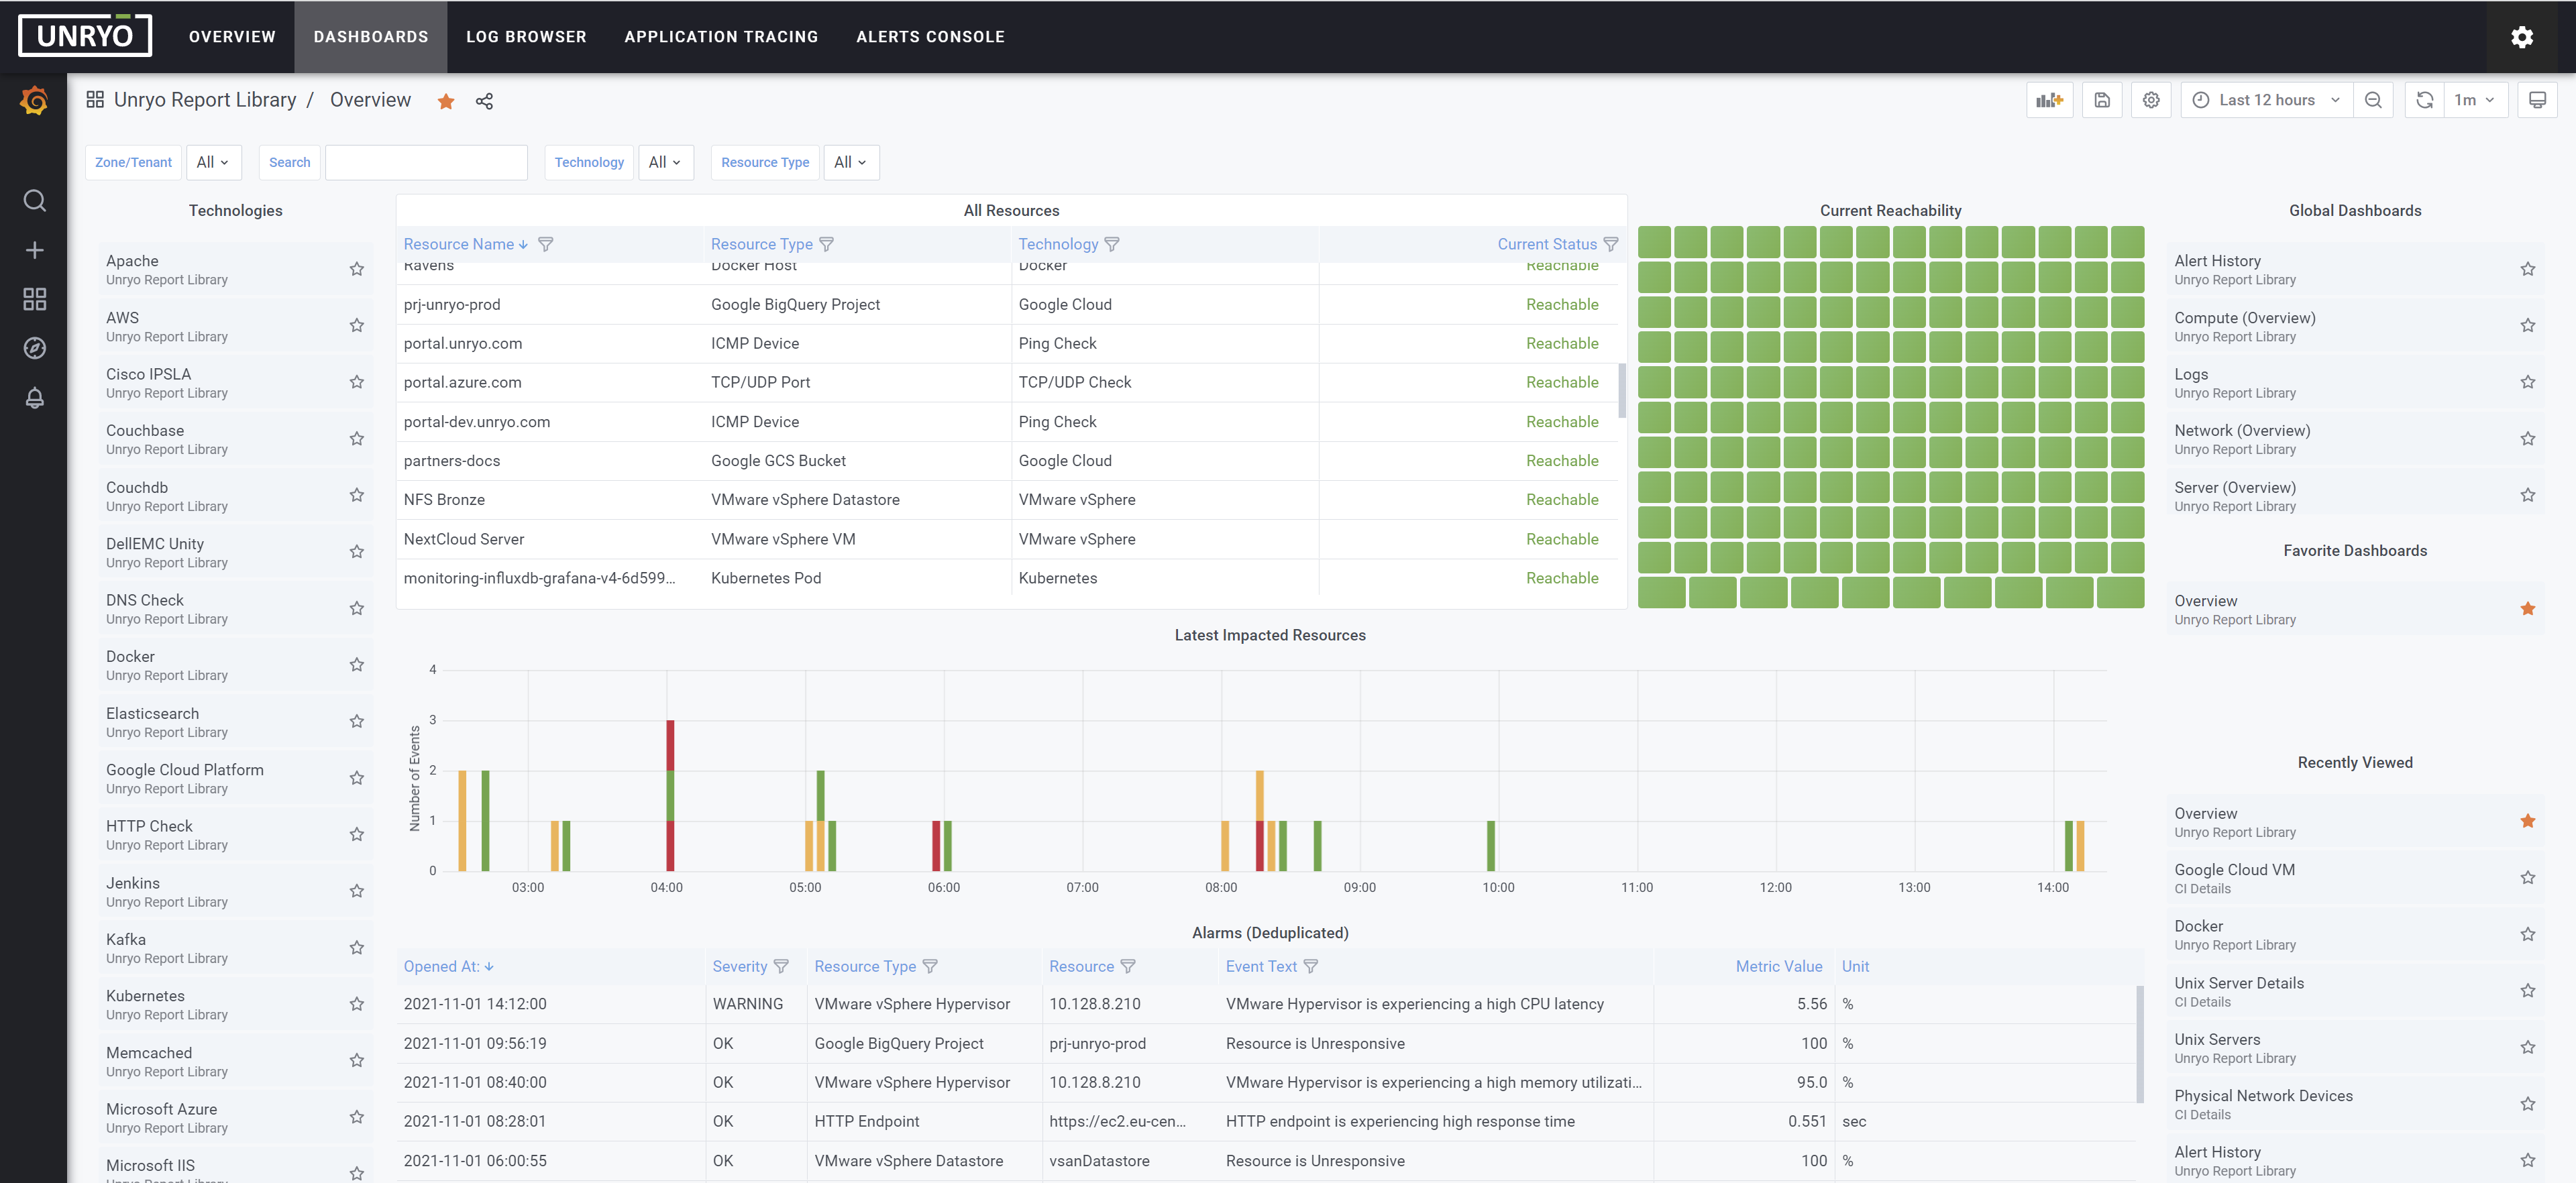
Go in Dashboards to browse dashboards and see data in real-time and over history.
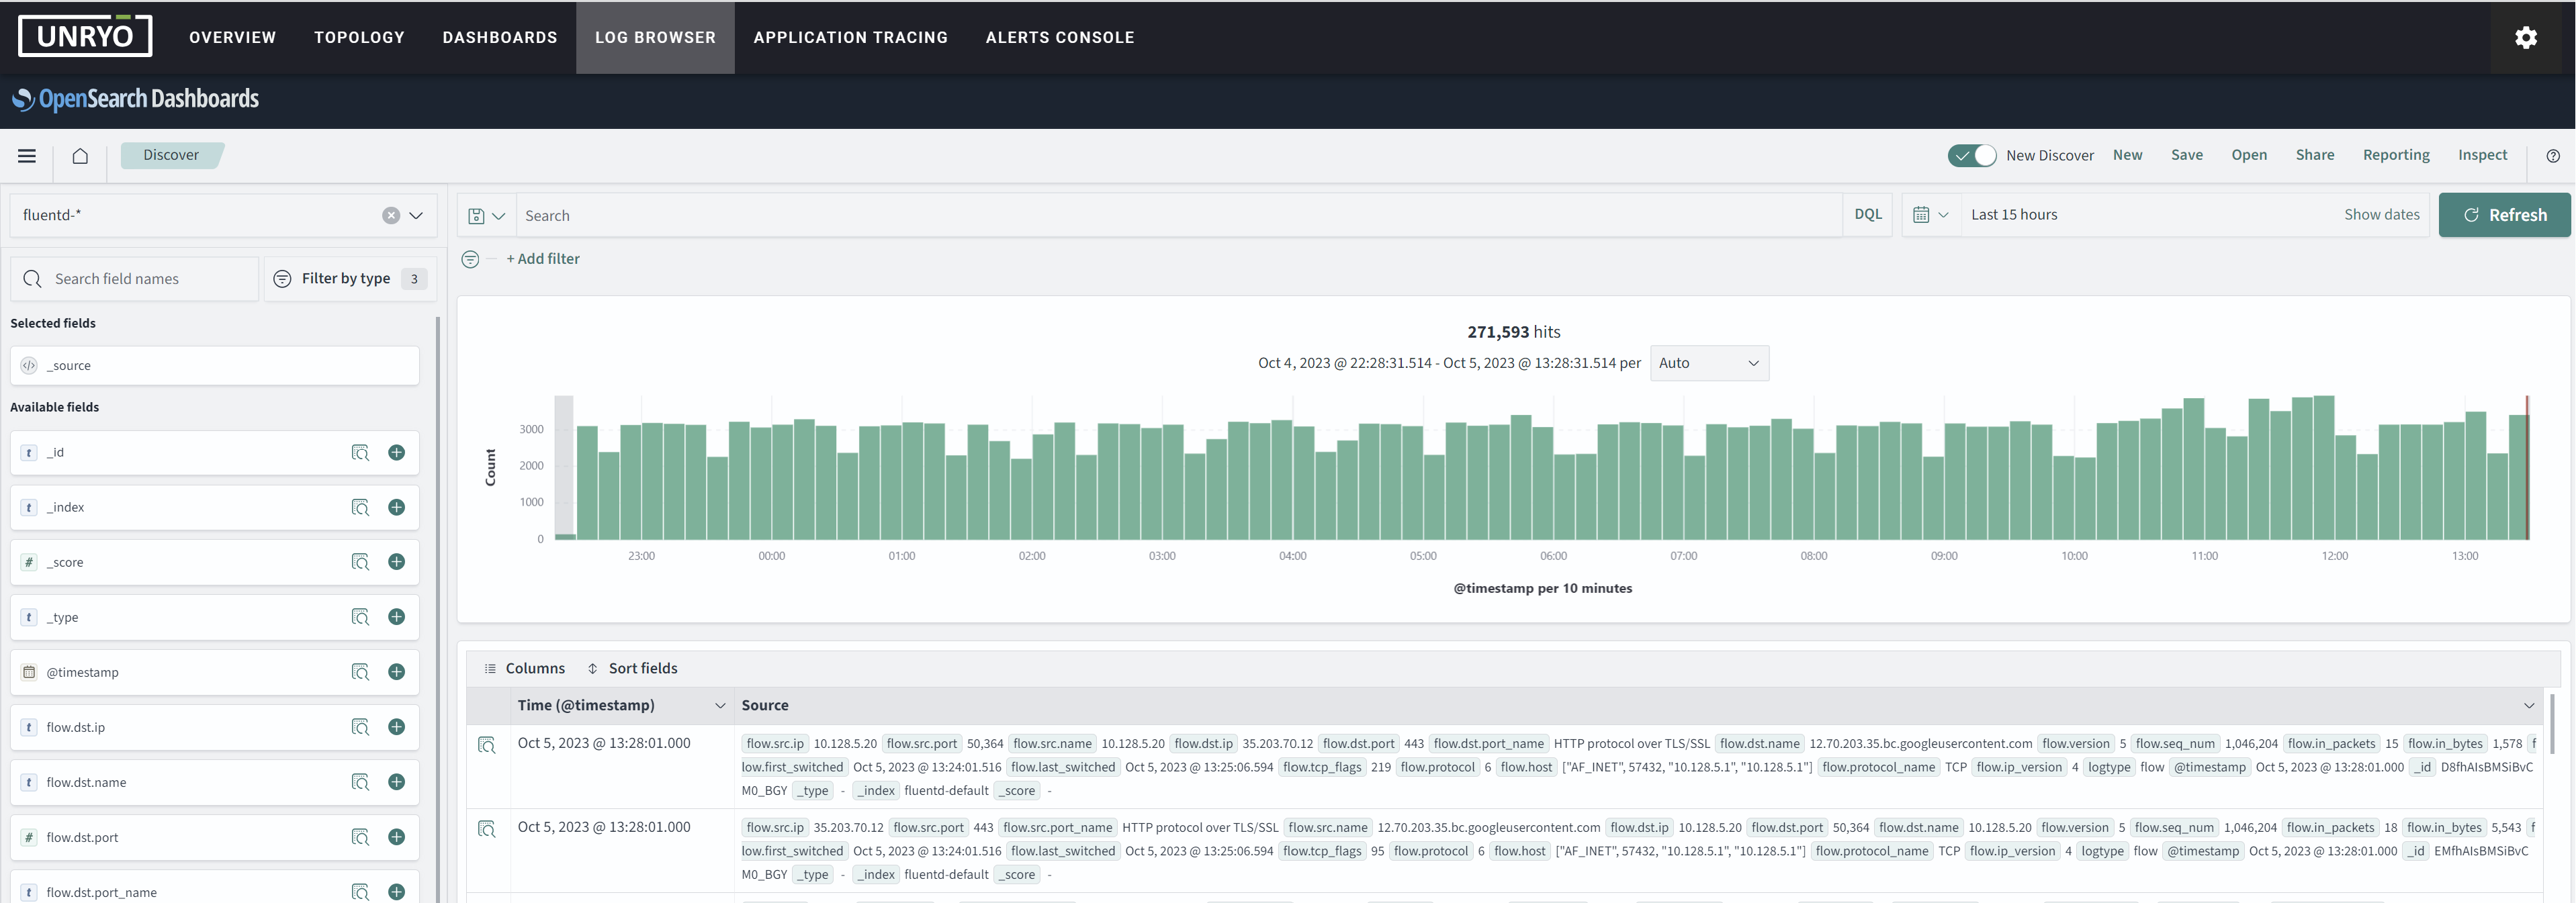
Go in Log Browser to view and search across all logs and events.
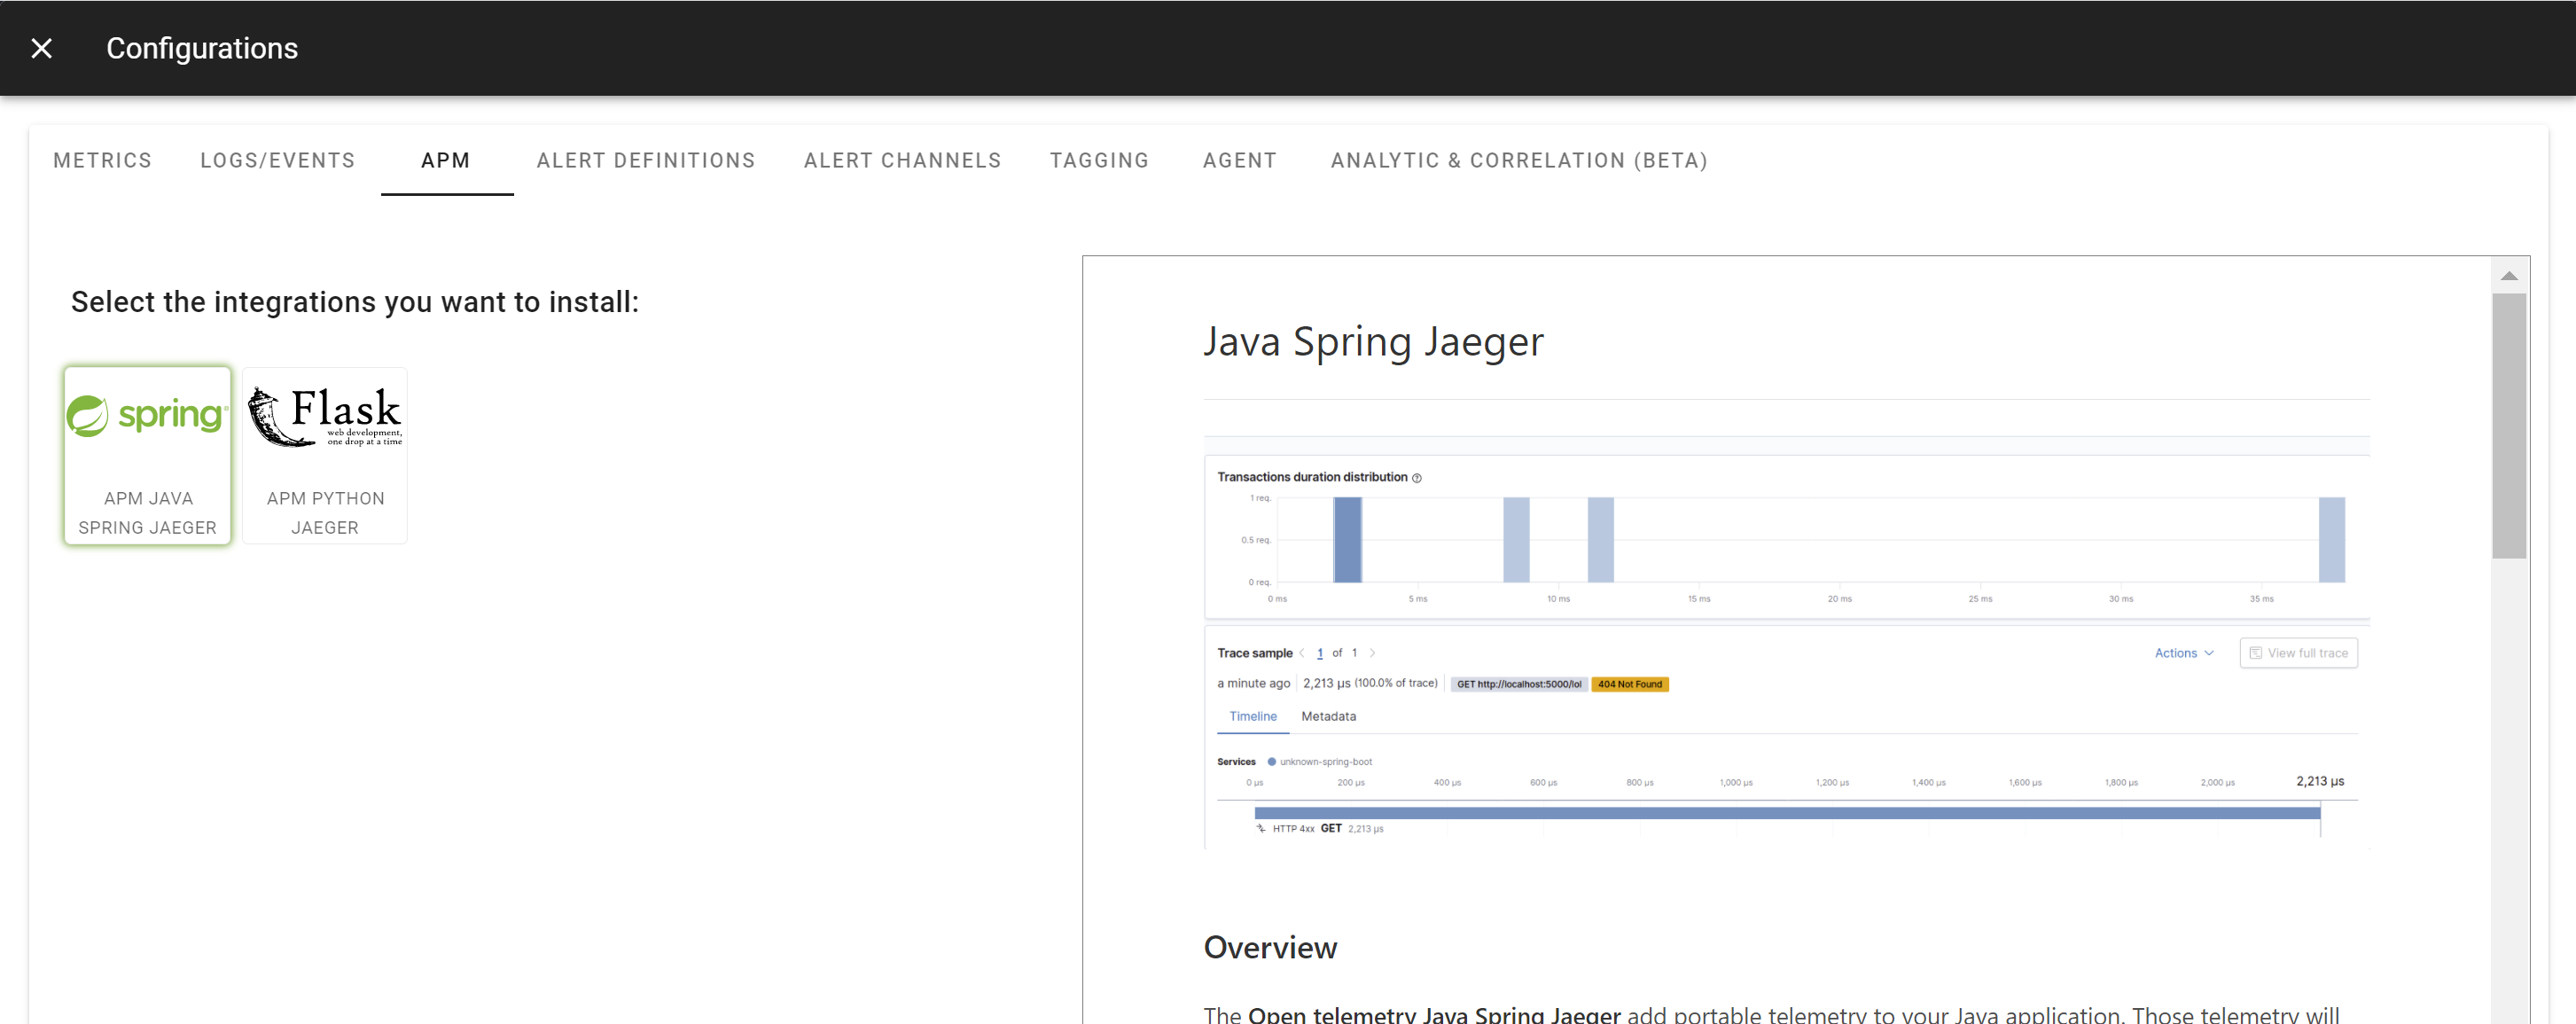
Go in Application Tracing to understand the health of instrumented applications.
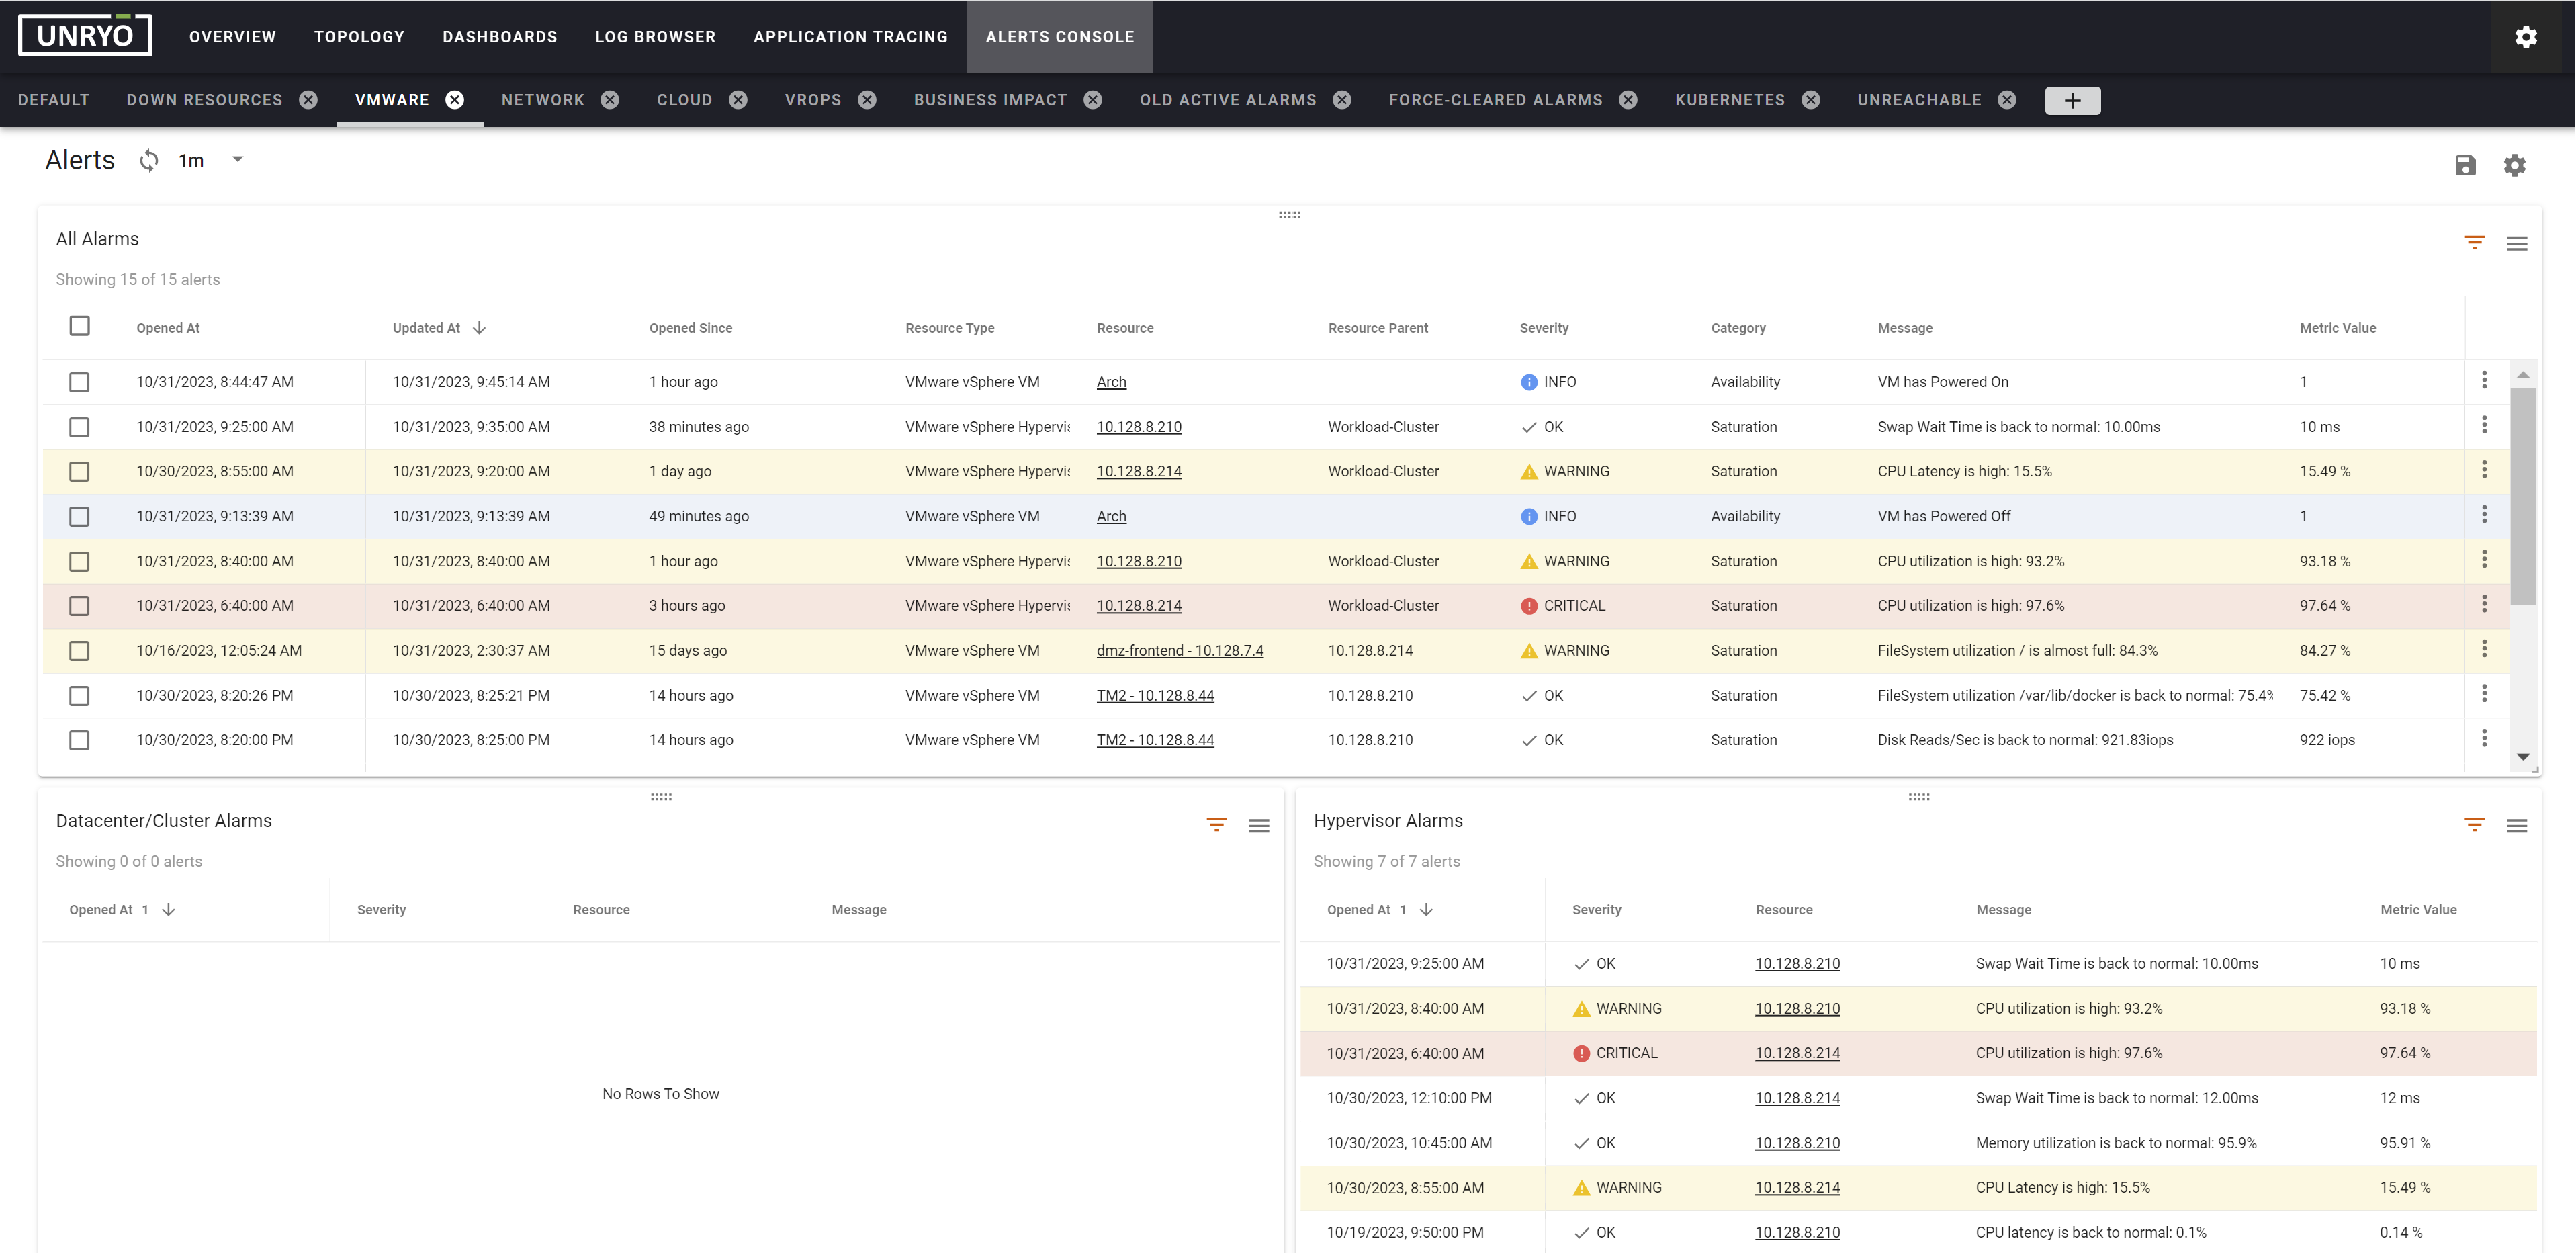
Go in Alerts Console to view and manage all the active alerts in your organization.