Collect Metrics#
How Unryo gathers data#
In Unryo, the Collector is responsible to gather metrics by actively polling them or by receiving them.
Metric can come from various sources:
- from a device or application directly, via periodic polling (SNMP, API endpoint, ...) or ingestion (TCP stream, Webhook, ...).
- from a synthetic test, such as ICMP, TCP or Speedtest queries.
- from an external system, such as a monitoring tool or a custom data source.
- from log data, when a log-to-metric aggregation is configured.
- calculated/derived from other metrics, such as a KPI, a business service status, etc.
All the metric-related configuration work is available from the console UI. The Unryo Vault stores all the configurations, while the configuration UI edits them and dictates how to propagate them securely to the target components.
- Start Polling
- Enable a predefined MLPack
- Add tags
- Configure Data Retention
- Clean-up inactive metric series
- Search and delete data
Predefined Polling Configurations#
Unryo supports 100+ predefined integrations, called MLPacks, to collect metrics and metadata on popular technologies and across all the stack: server, network, applications, clouds.
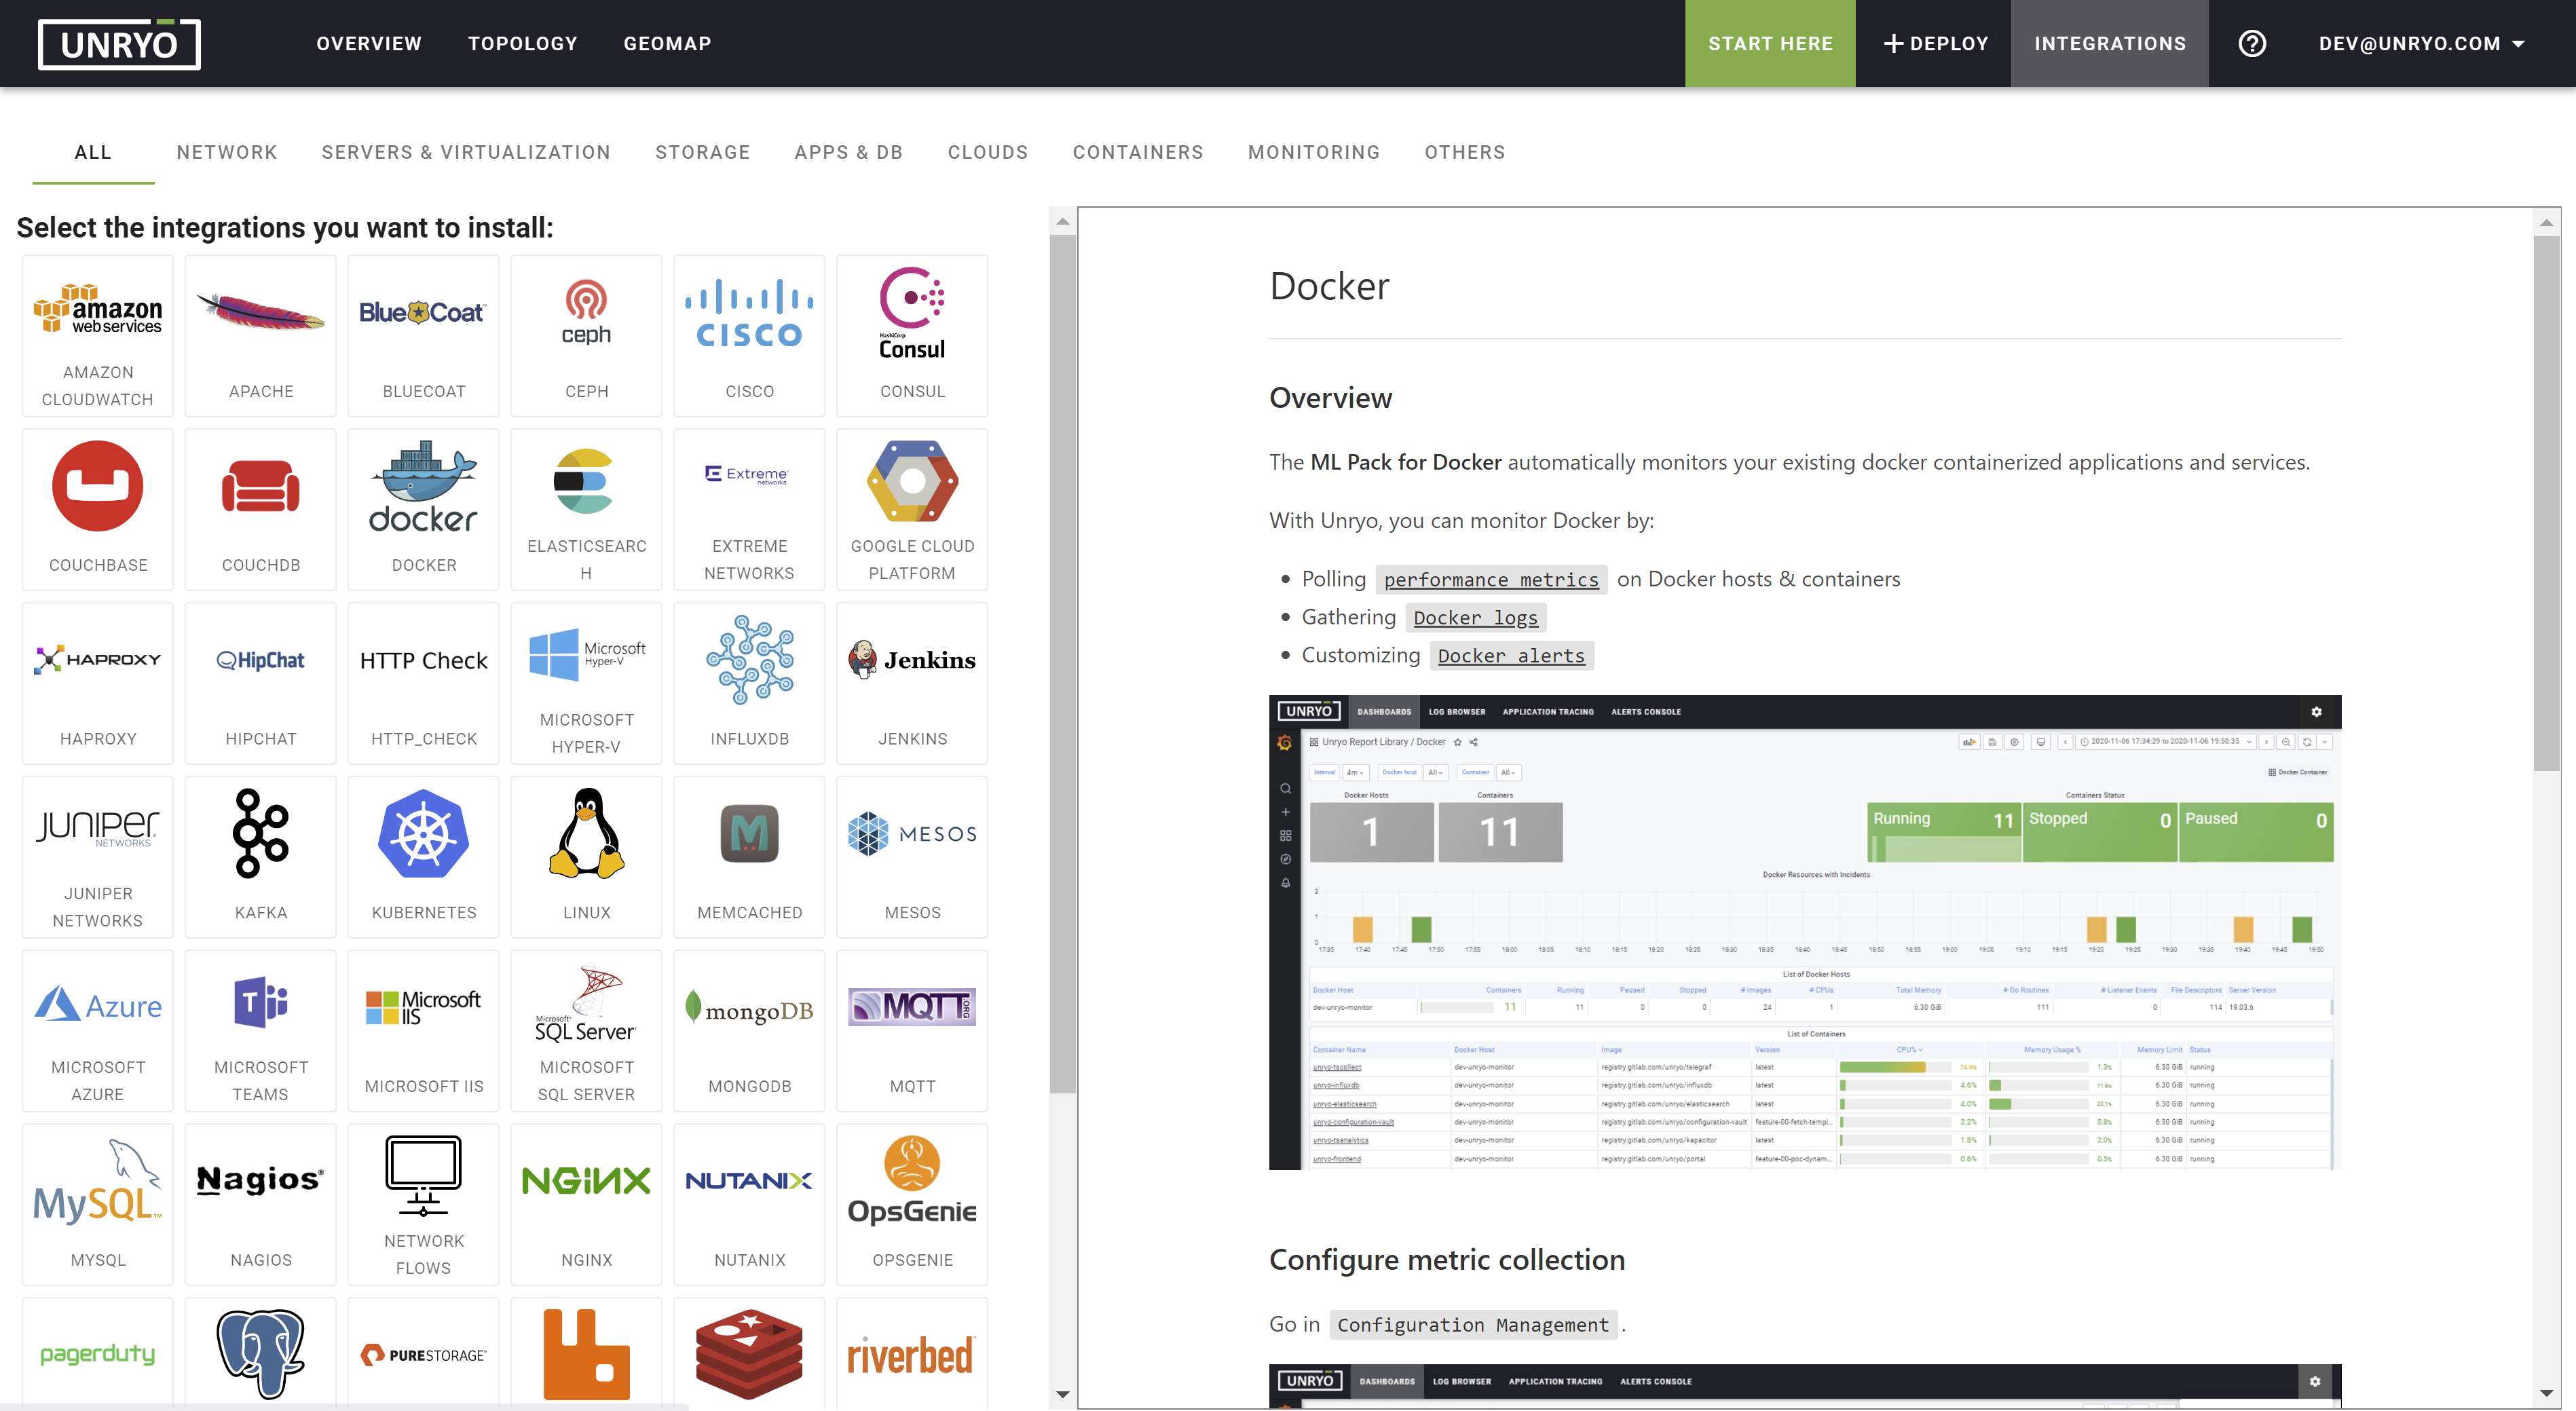
To start collecting data, follow the procedure here.
Start Polling#
The Unryo platform is template-based. A Configuration UI centrally manages all your configurations, and facilitates the operation to add, update, push telemetry configurations to one or multiple collectors or other components, just in few clicks, from a single pane.
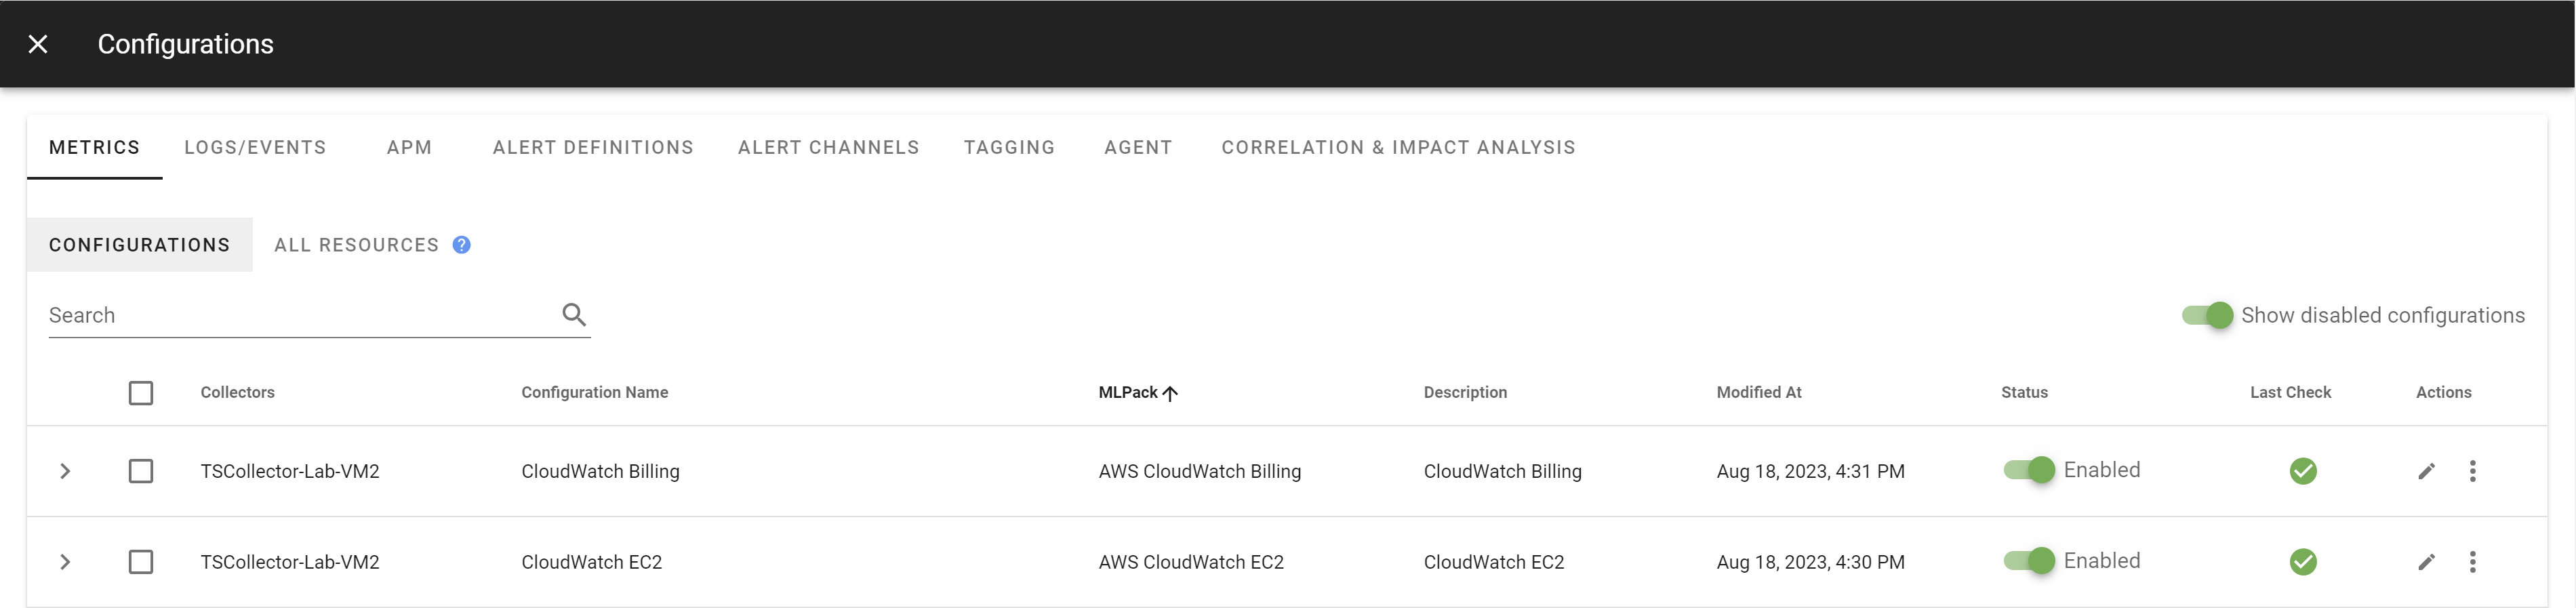
To use the Configuration UI, follow the procedure here.
All your configurations are stored encrypted in a central vault, which serves as the communication channel back to your collectors.
Enable a polling configuration using the Vault API#
To configure collectors and select configurations to apply on, you can use the Vault API.