Connect your data sources#
What You'll Accomplish#
In this guide, you will:
- Deploy a Unryo Collector in your environment
- Start gathering data using pre-built templates
Prerequisites#
Before you begin, ensure you have:
- An active Unryo account. If not, create one here.
- Access to your infrastructure: network devices, servers, or applications to monitor.
- Minimum system resources:
- VMware vApp: 4 GB RAM (8 GB recommended), ~50 GB storage.
- VMware vSphere 6.7+ and vCenter.
- Docker: Docker + Docker Compose installed.
- Network connectivity:
- Outbound access from the collector to your Unryo instance.
- Required ports/firewall rules open.
- Permissions to deploy VMs, containers, or pods in your environment.
Deploy Your First Collector#
To start monitoring, deploy at least one collector.
- Log in to your Unryo Admin Console.
- Select your deployment → Add Components.
- Choose Add a Single Collector → Private Infrastructure.
- Pick a deployment method: Docker Compose, VMware vApp, or Kubernetes.
Option A — Docker Compose#
- Copy the generated YAML into
docker-compose.ymlon your target host. - Start services:
cd /path/to/compose-file
docker-compose up -d
- If your file has a different name:
docker-compose -f <file>.yml up -d
Option B — VMware vApp#
-
Download the
.ovafile generated by the wizard.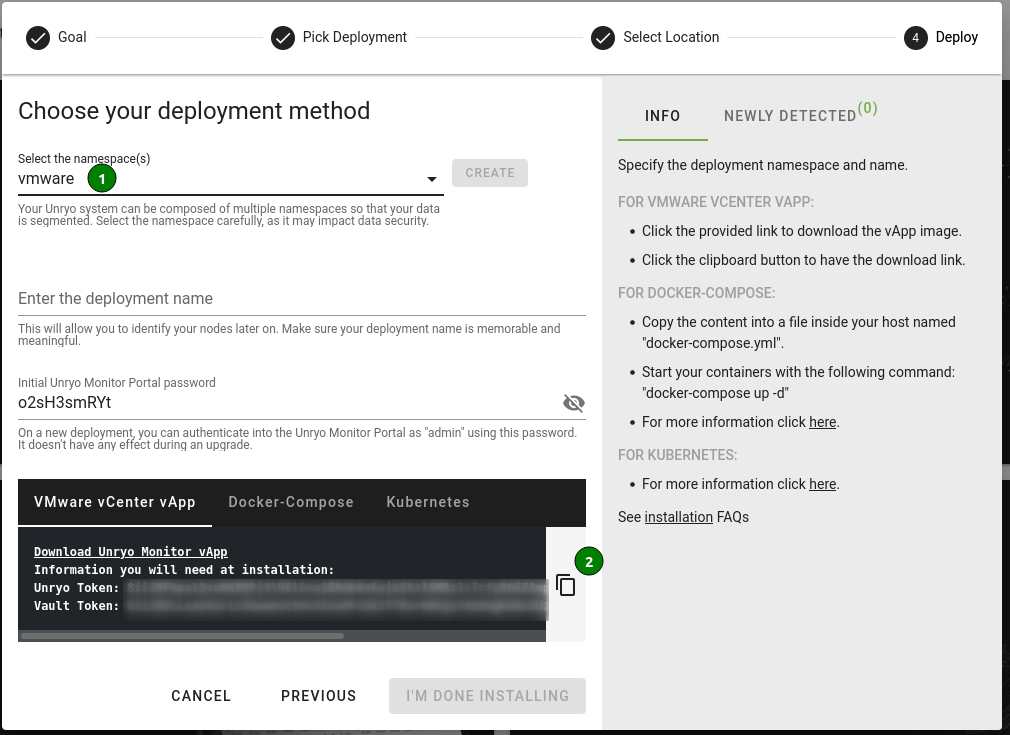
-
In vSphere Client:
-
Open a virtual machine and select the
.ovafile.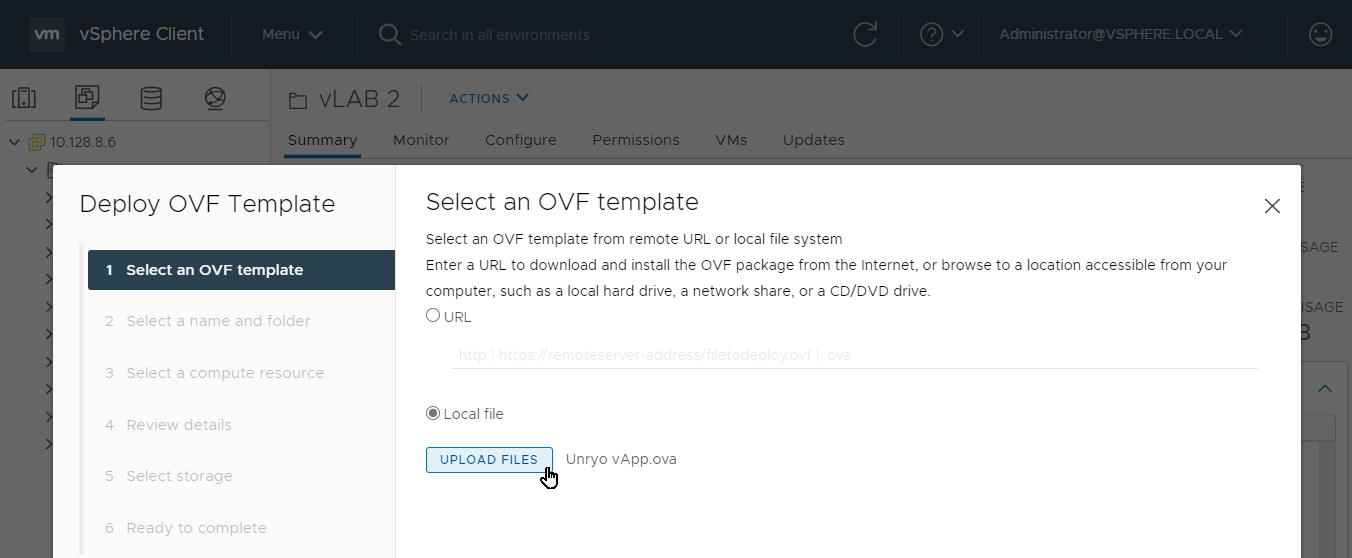
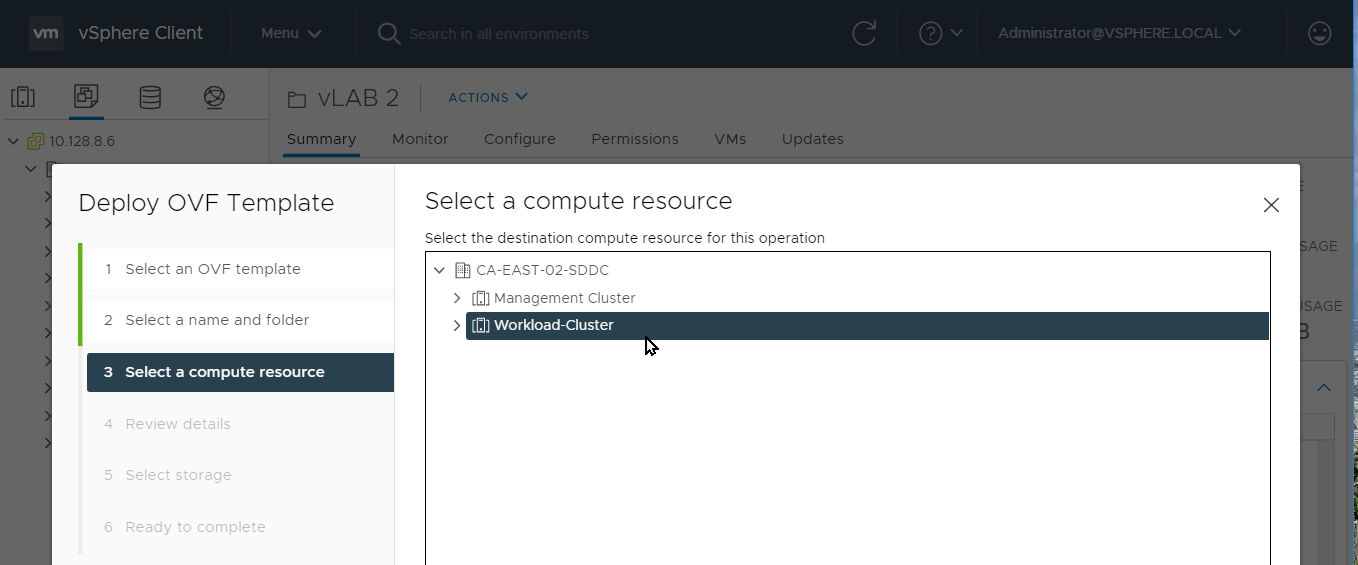
-
Select a compute resource (The Unryo Collector vApp requires min. 4 GB RAM; 8 GB recommended).).
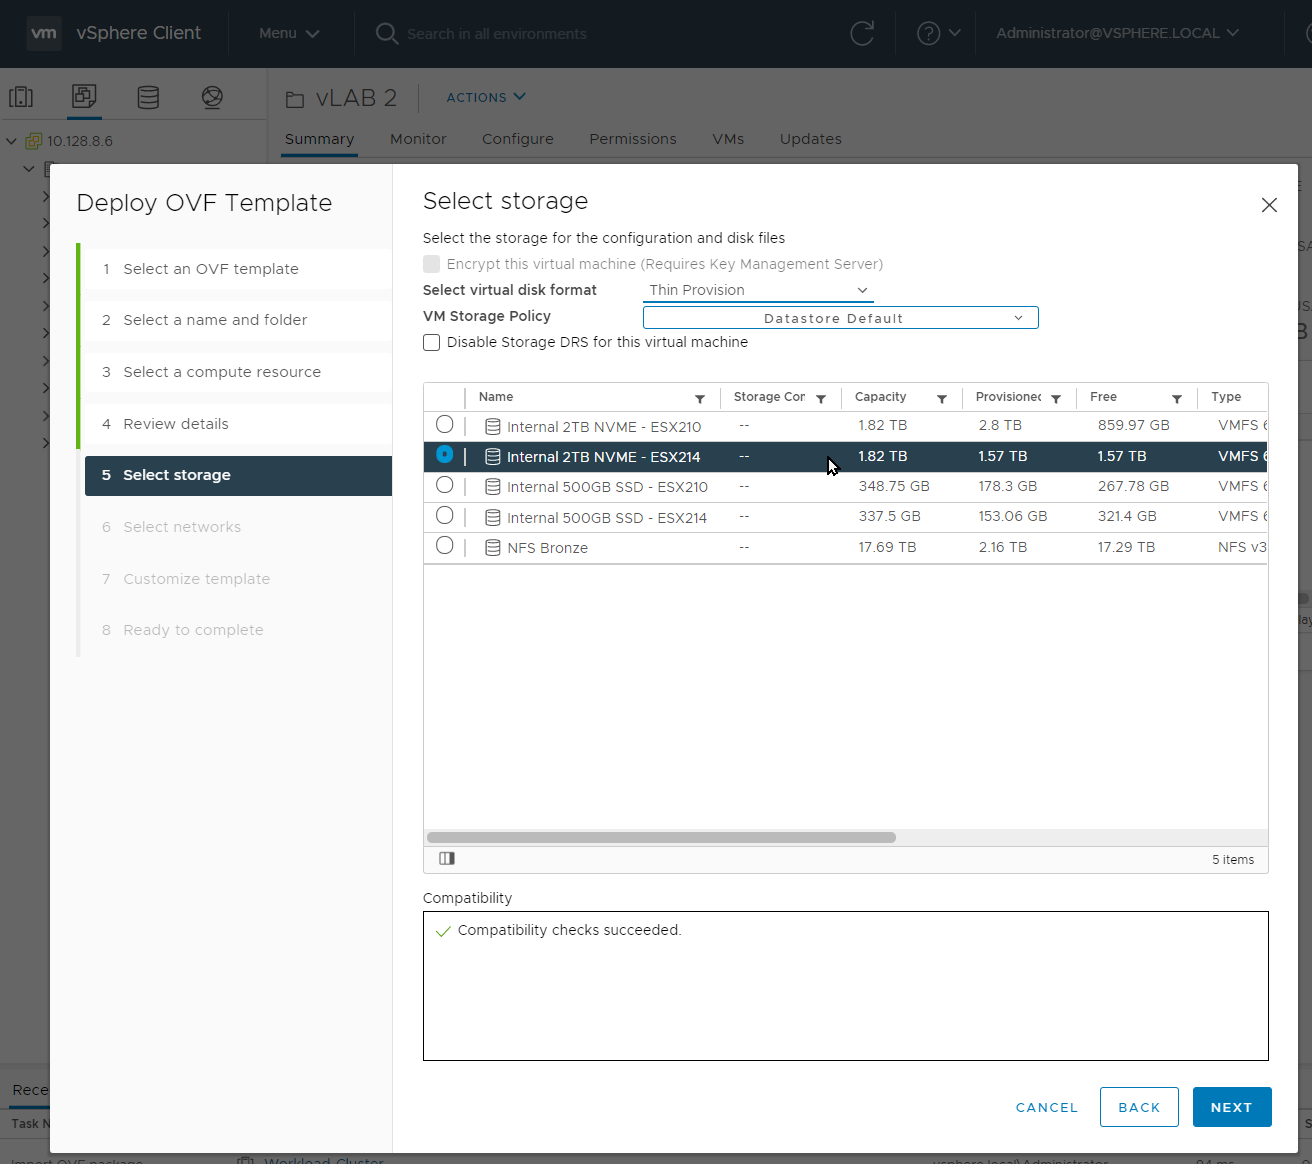
-
Select your storage (assign at least 50 GB storage)
-
Select your networks
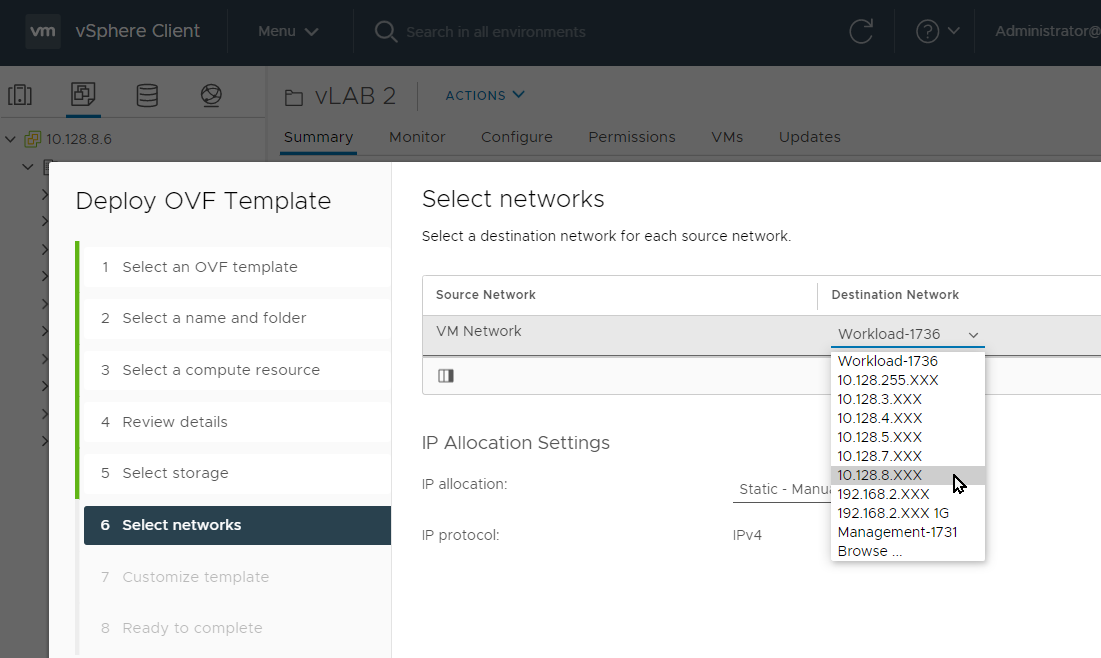
-
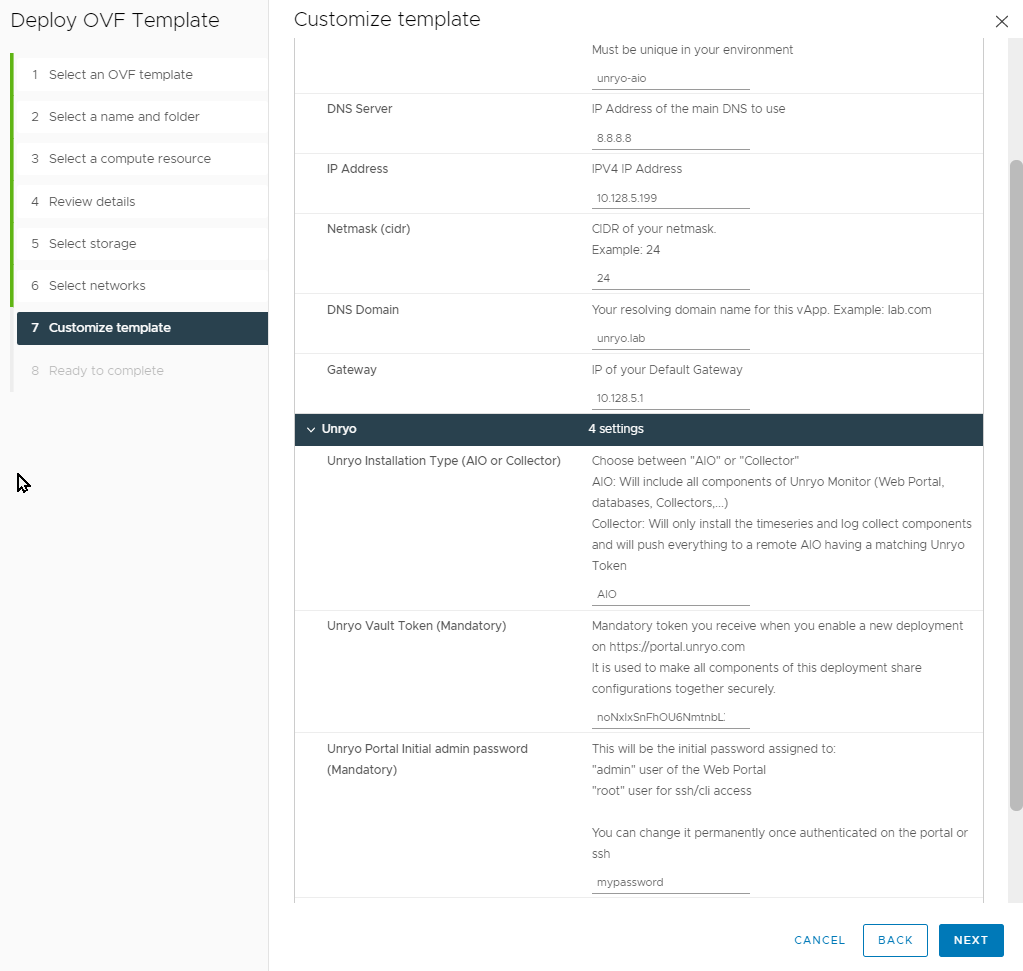
Custom vSphere Application
- Under the custom template network tab, all the fields are required (ensure the IP is free/unassigned)
- Under the Unryo tab, provide the token you received previously (from Unryo portal)
-
Click next when ready. Allow a few minutes for all internal components to boot up and connect.
-
Option C — Kubernetes#
- Follow the procedure here
Post-Deployment Checks#
- Wait about 1 minute after deployment. Once the installation completes, the collector will automatically start and securely register with your Unryo platform.
- Default password is the same for root (CLI) and admin (web UI); update it later.
- Check the VM’s console or container logs for service startup messages.
Great! You have completed the first step of this Tutorial.
Your collector is now operational!
Out of the box, a fresh collector monitors its own server and containers. To extend visibility, you will learn in next step how to start gathering data.
Start gathering data#
-
Go in the
Overviewpage and click on your Unryo Portal's URL:
-
Go in
Configuration Management.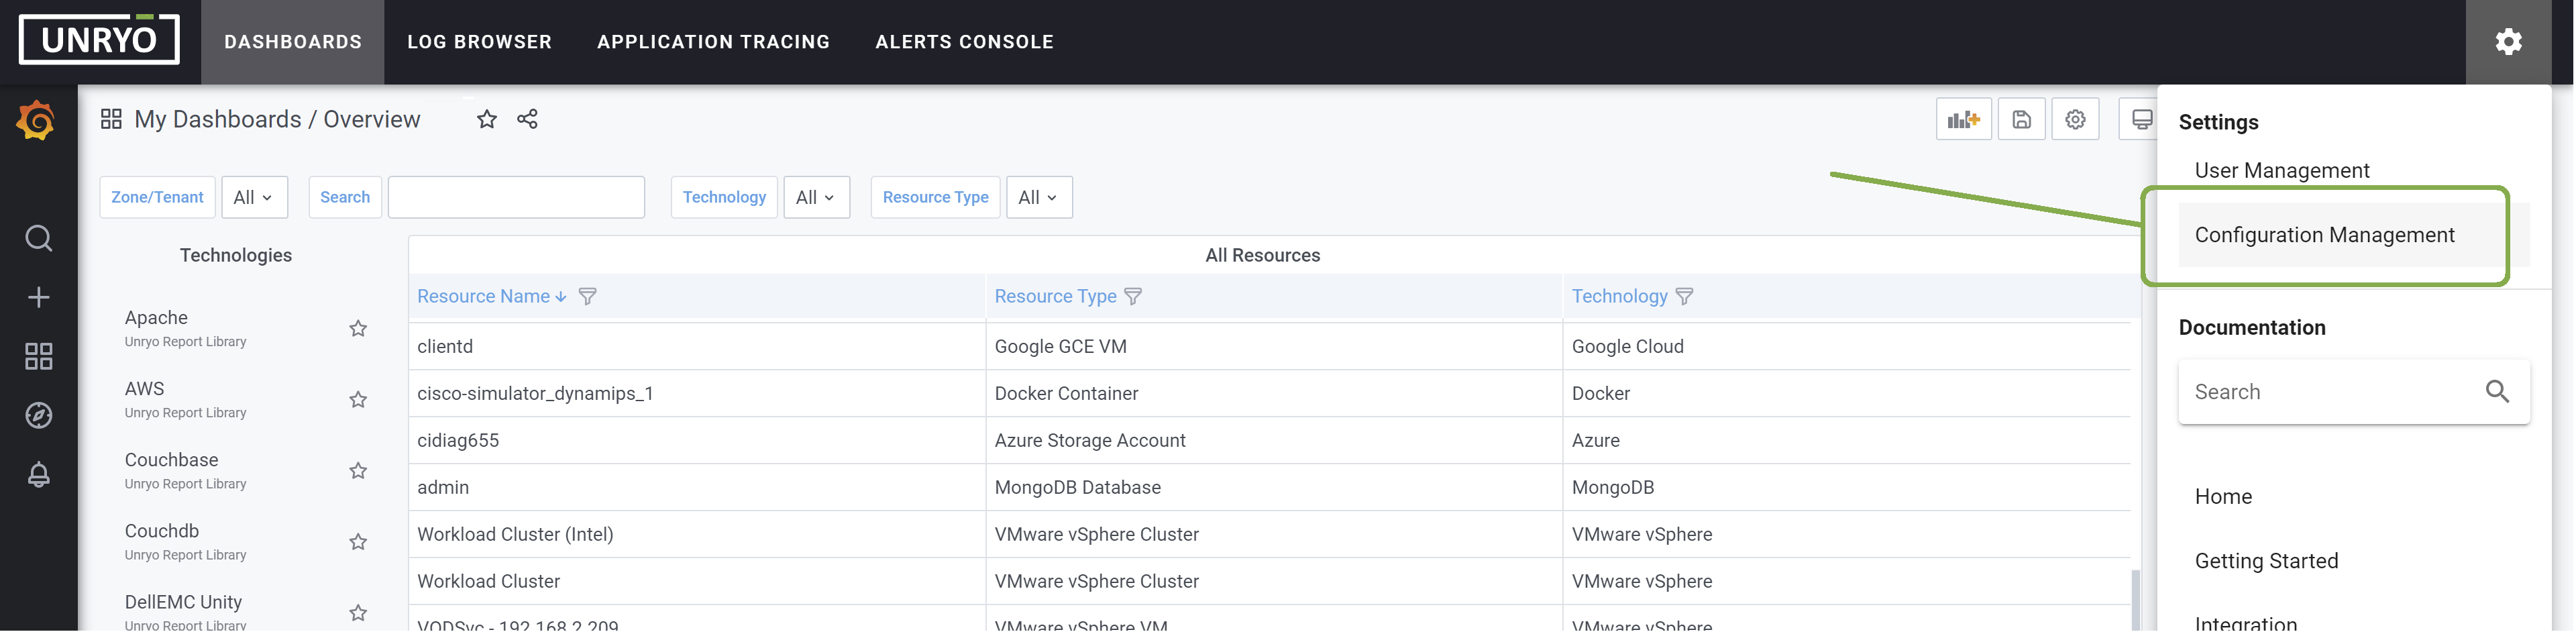
-
Click on the
+button to add a new configuration.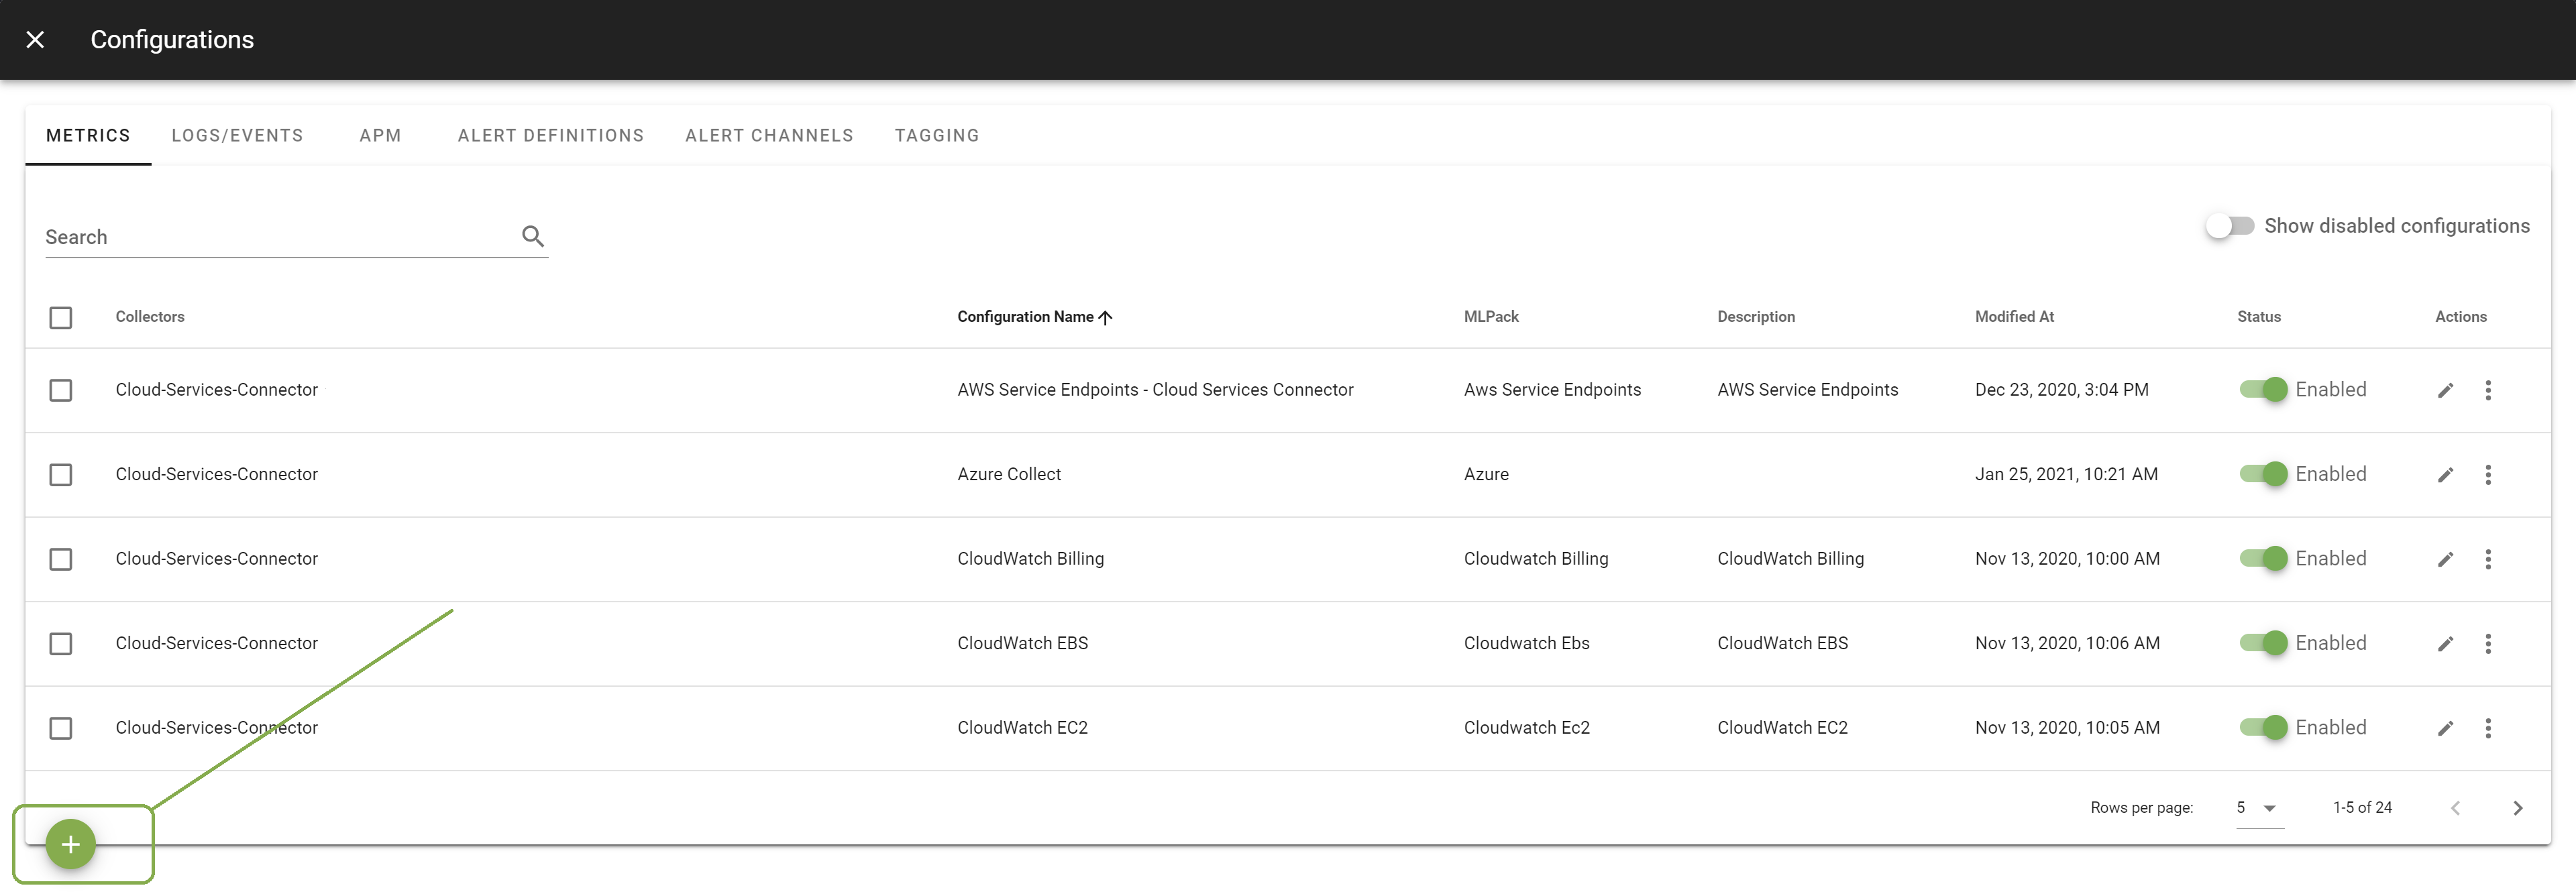
-
Choose a template (for this tutorial, select
Http Response). Choose the Collector to deploy on; Enter aConfiguration Name.Descriptionis optional.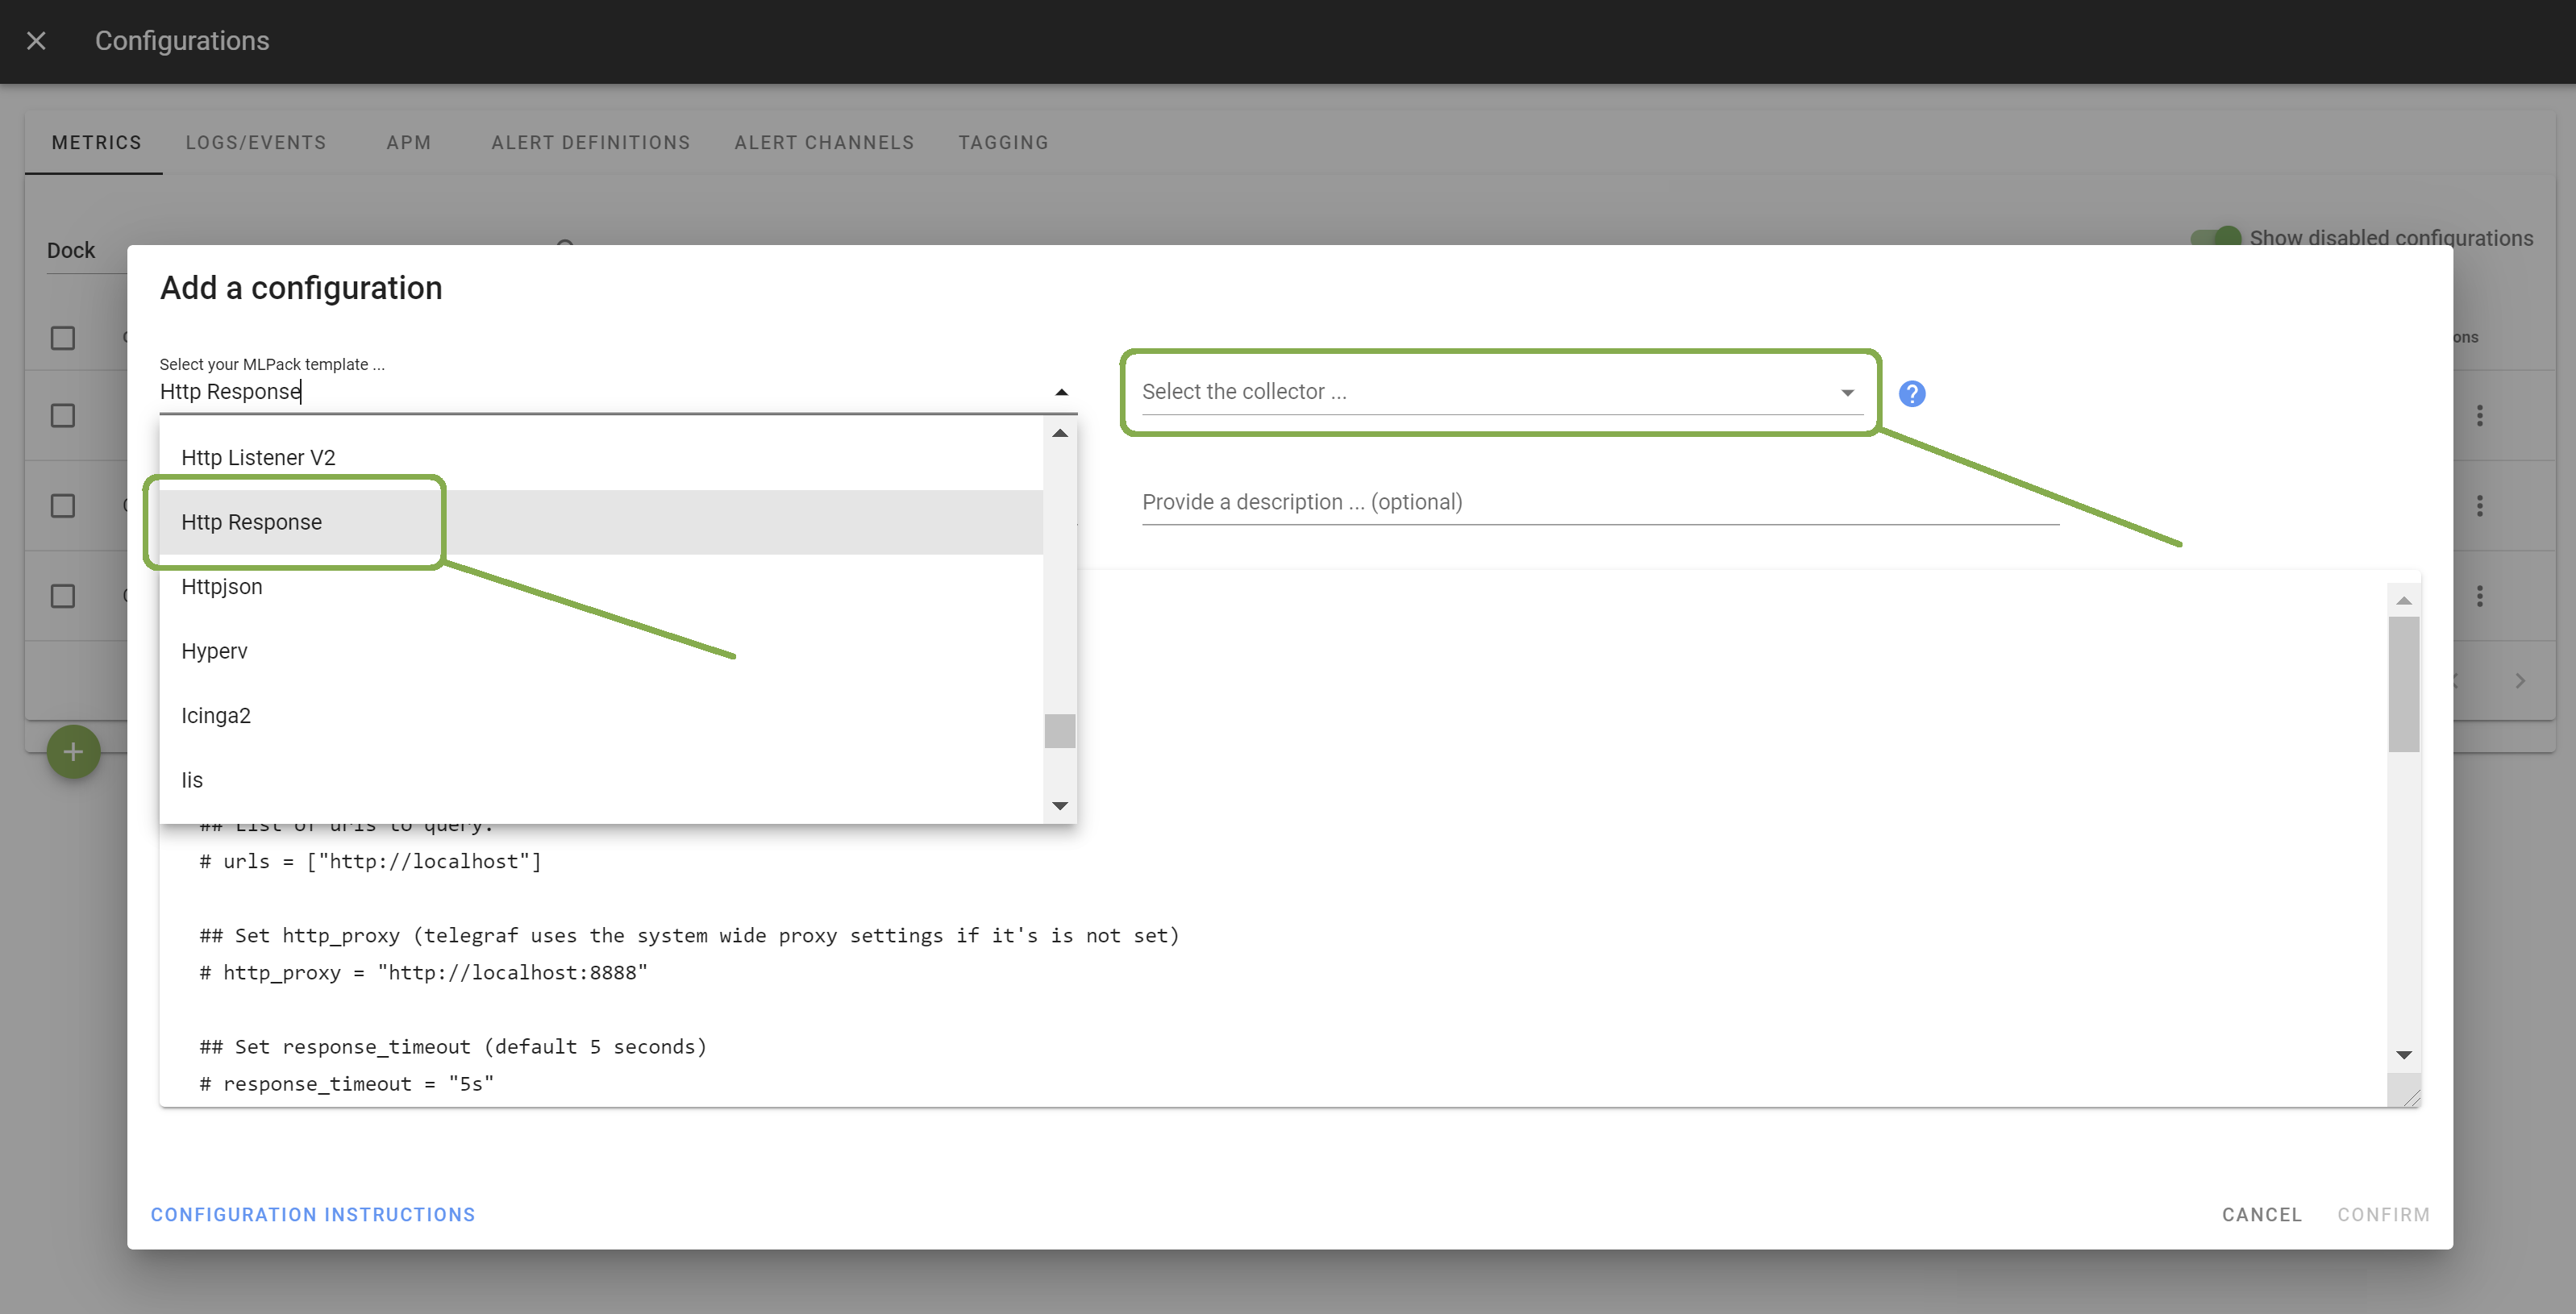
-
Enter the
list of URLsto monitor. Explore additional template options.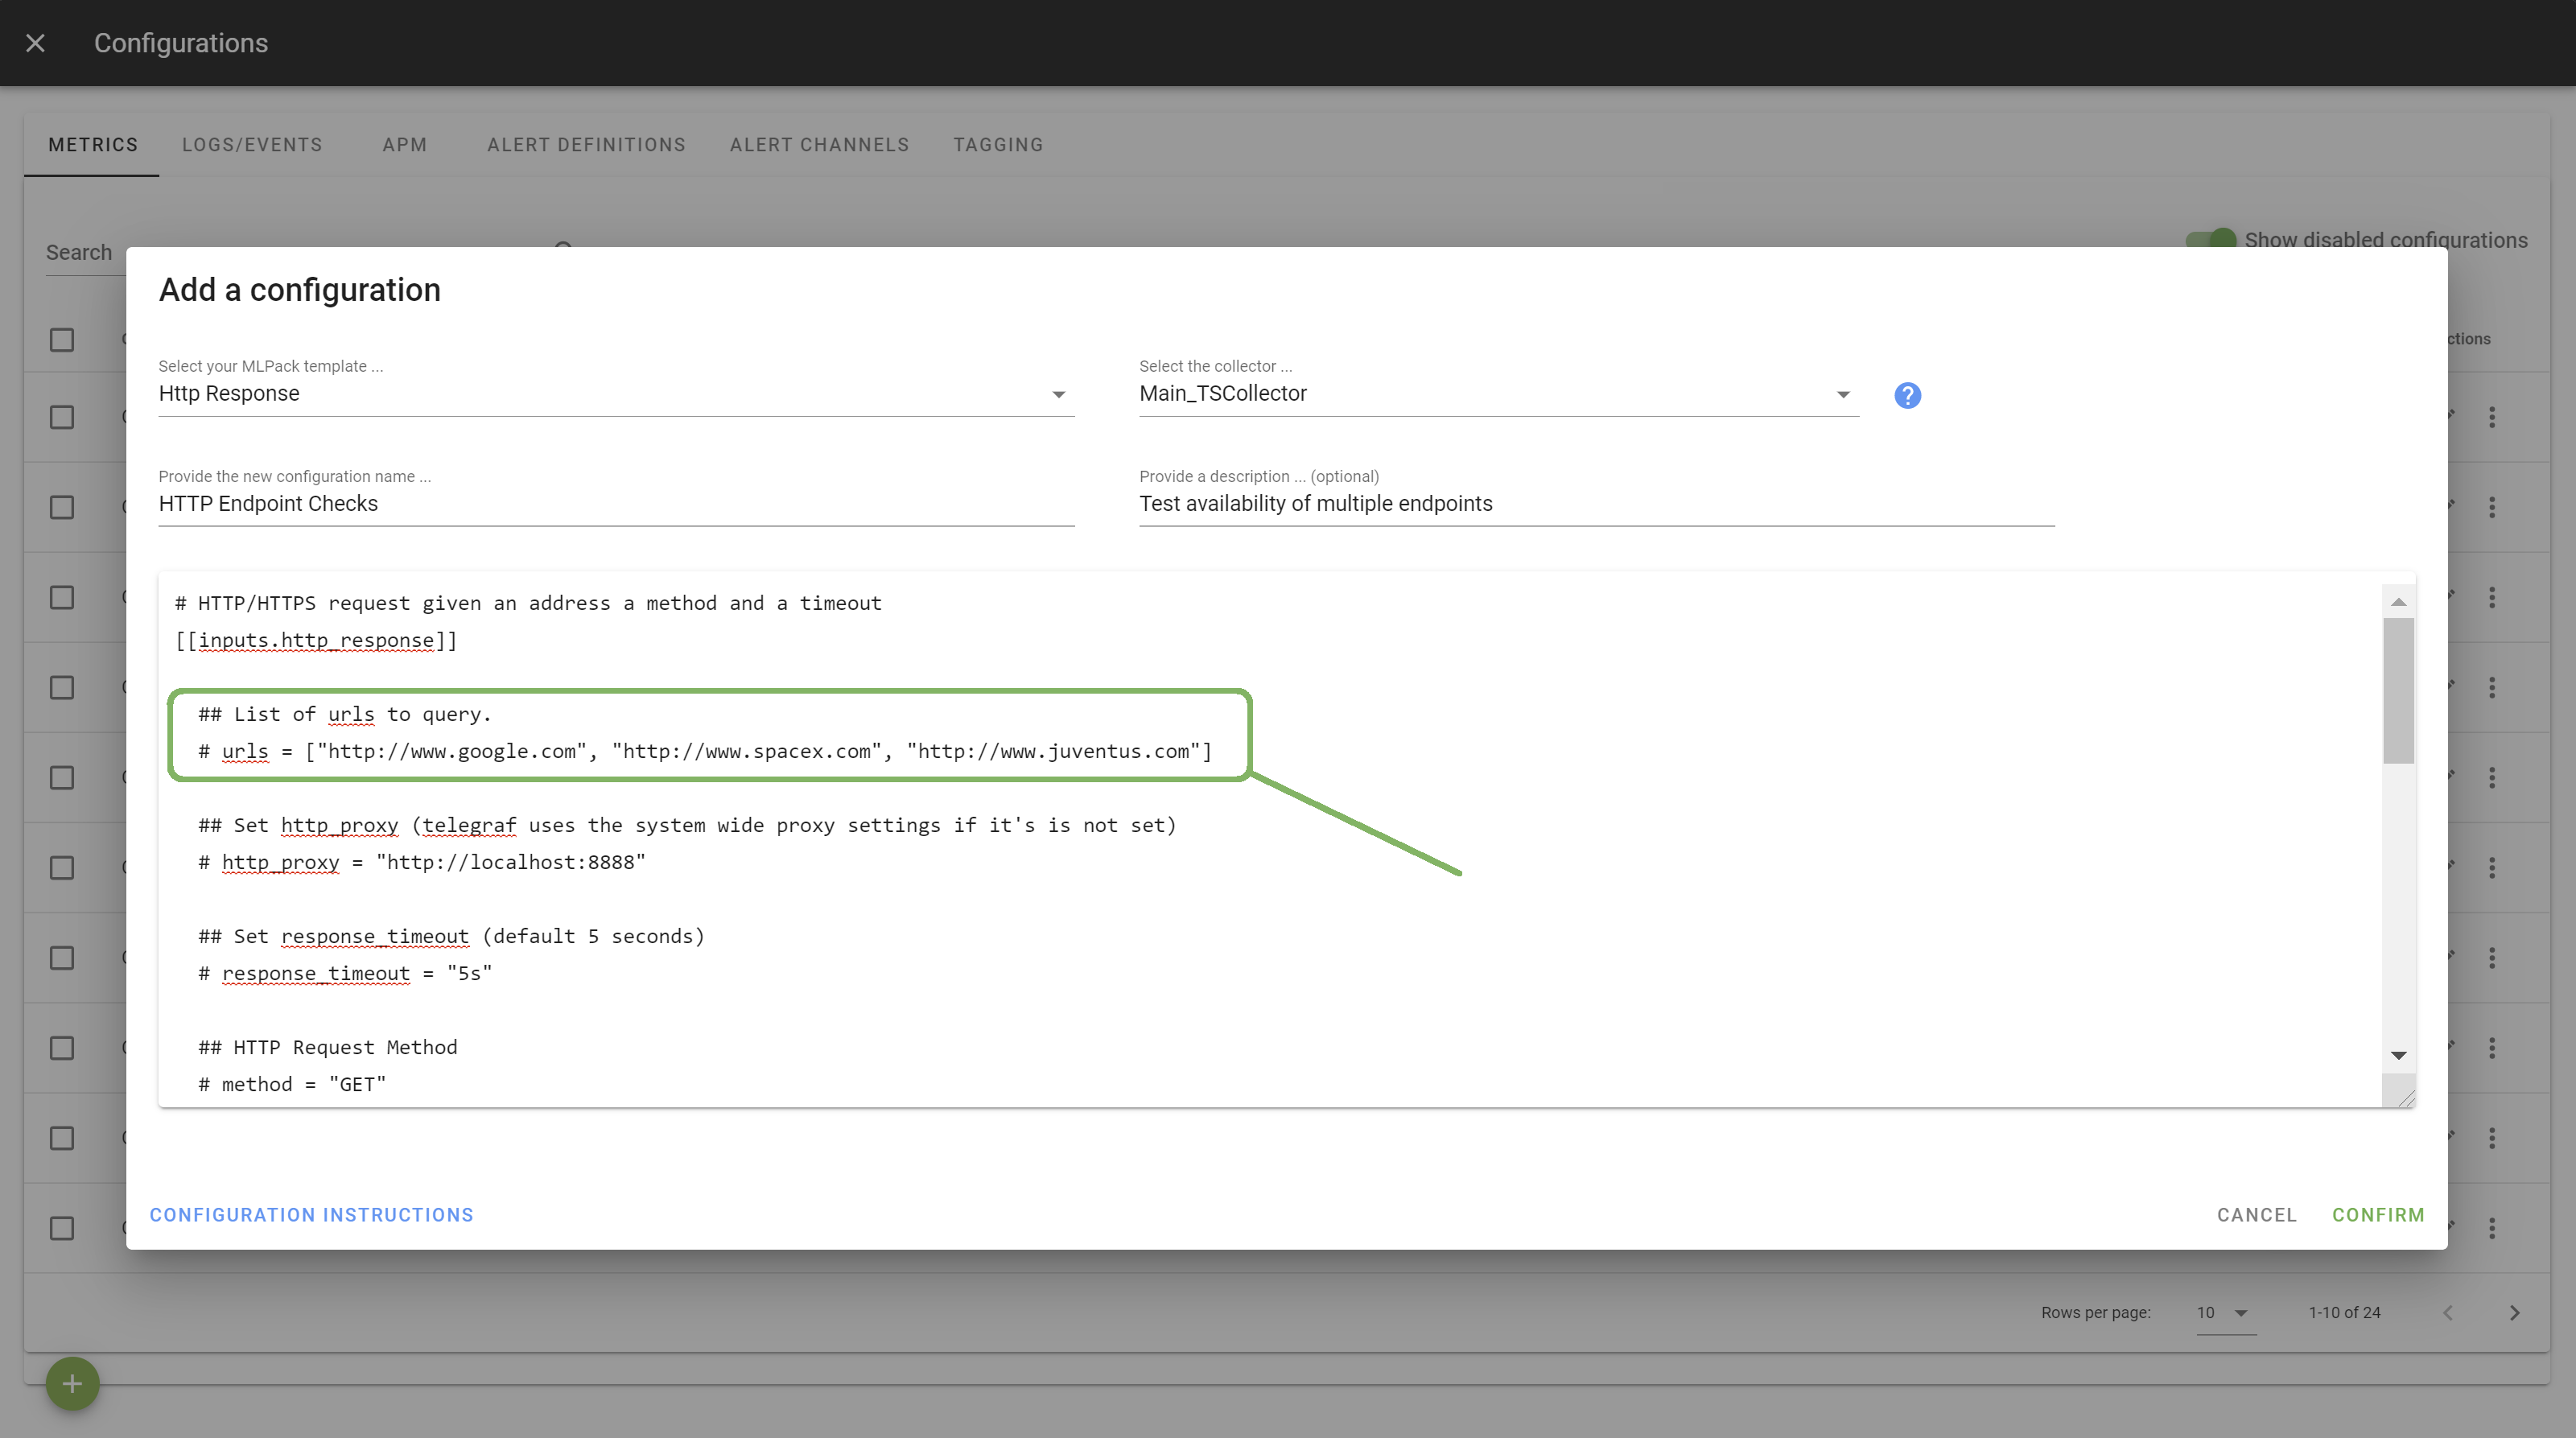
-
Click
Applyto start monitoring.
Congratulations! You just started a new monitoring. Metrics begin to be uploaded, stream analytics runs in the background. Your next step is to discover the power of the Unryo portal and Agentic AI activation.
What’s Next#
Next, start visualizing your data and get AI insights.