Nginx
Nginx#
Overview#
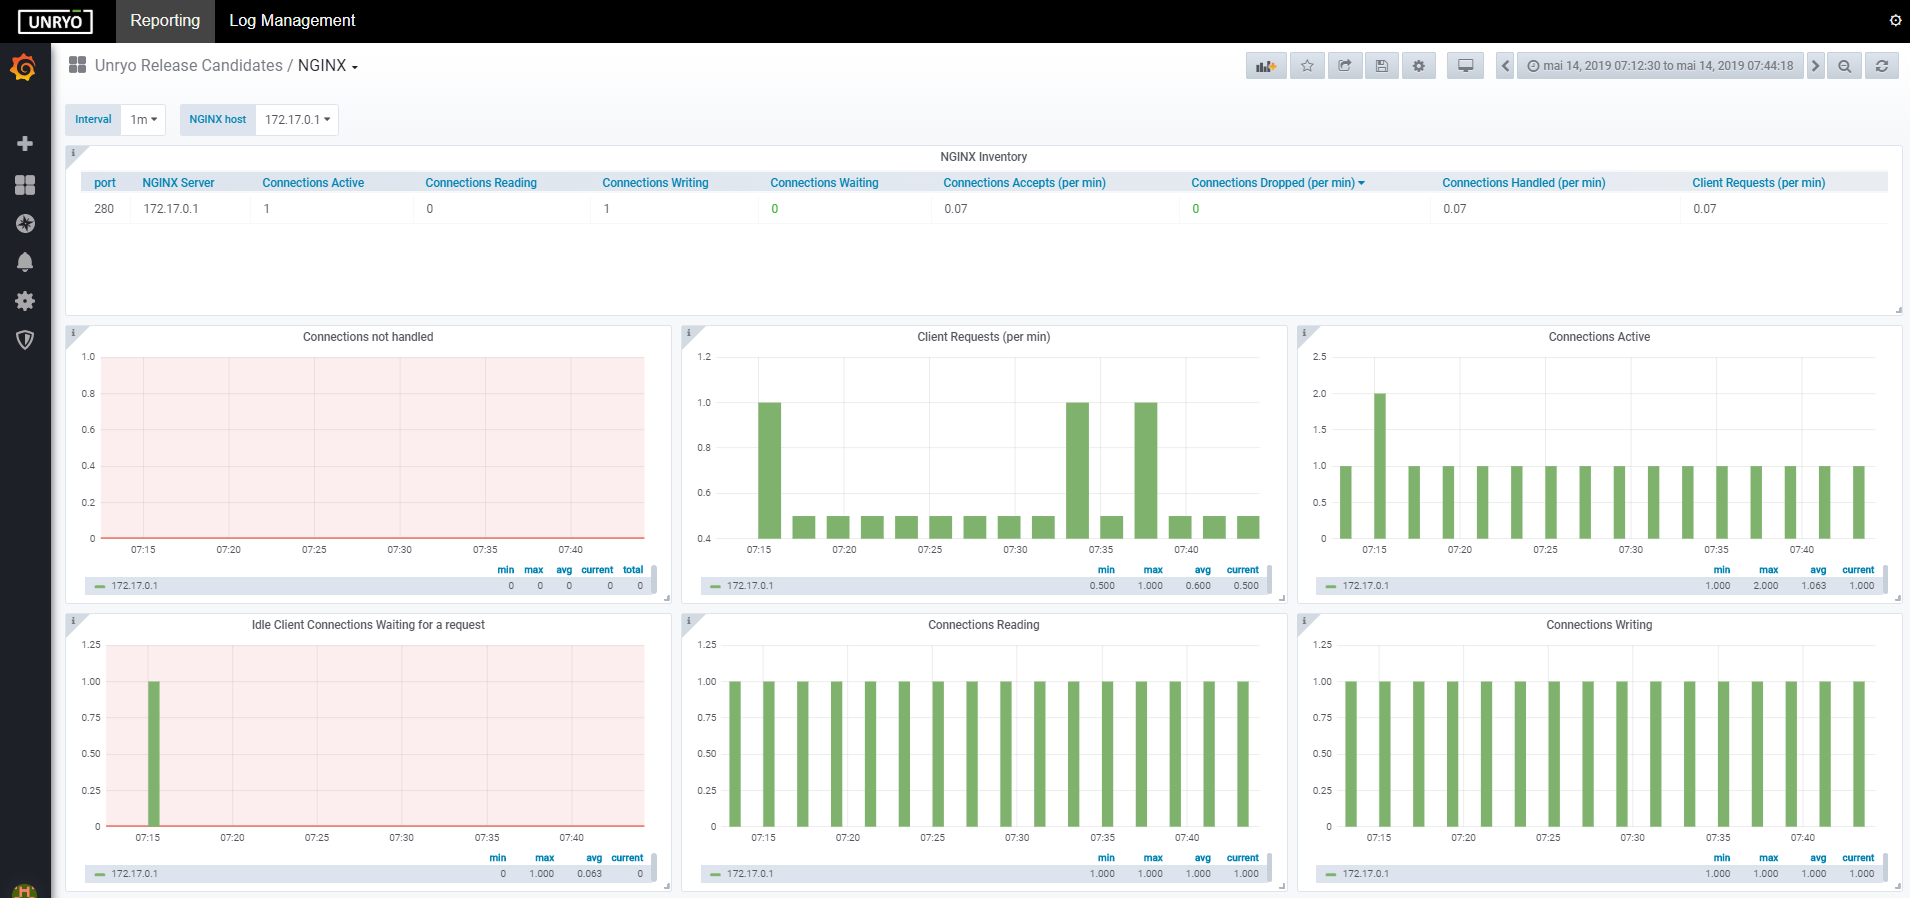
The ML Pack for NGINX monitors specific NGINX metrics (such requests, connections, system performance, traffic and throughput) and NGINX logs. Additional metrics are available if you use the NGINX Plus commercial version.
With Unryo, you can monitor NGINX by:
- Polling
performance metricson NGINX servers. - Gathering
NGINX logs - Customizing
NGINX alerts
Configure metric collection#
NGINX Prerequisites#
You need to enable stub_status module in a location to make metrics available for Unryo Collector, by editing the /etc/nginx/conf.d/status.conf as below:
server {
    listen 80 default_server;
    listen [::]:80 default_server;
    location /nginx_status {
          stub_status on;
          access_log   off;
          allow 172.17.0.1;
          deny all;
        }
}
And reload NGINX: nginx -s reload
You can test if everything ok by running the following command: curl 127.17.0.1:80/nginx_status
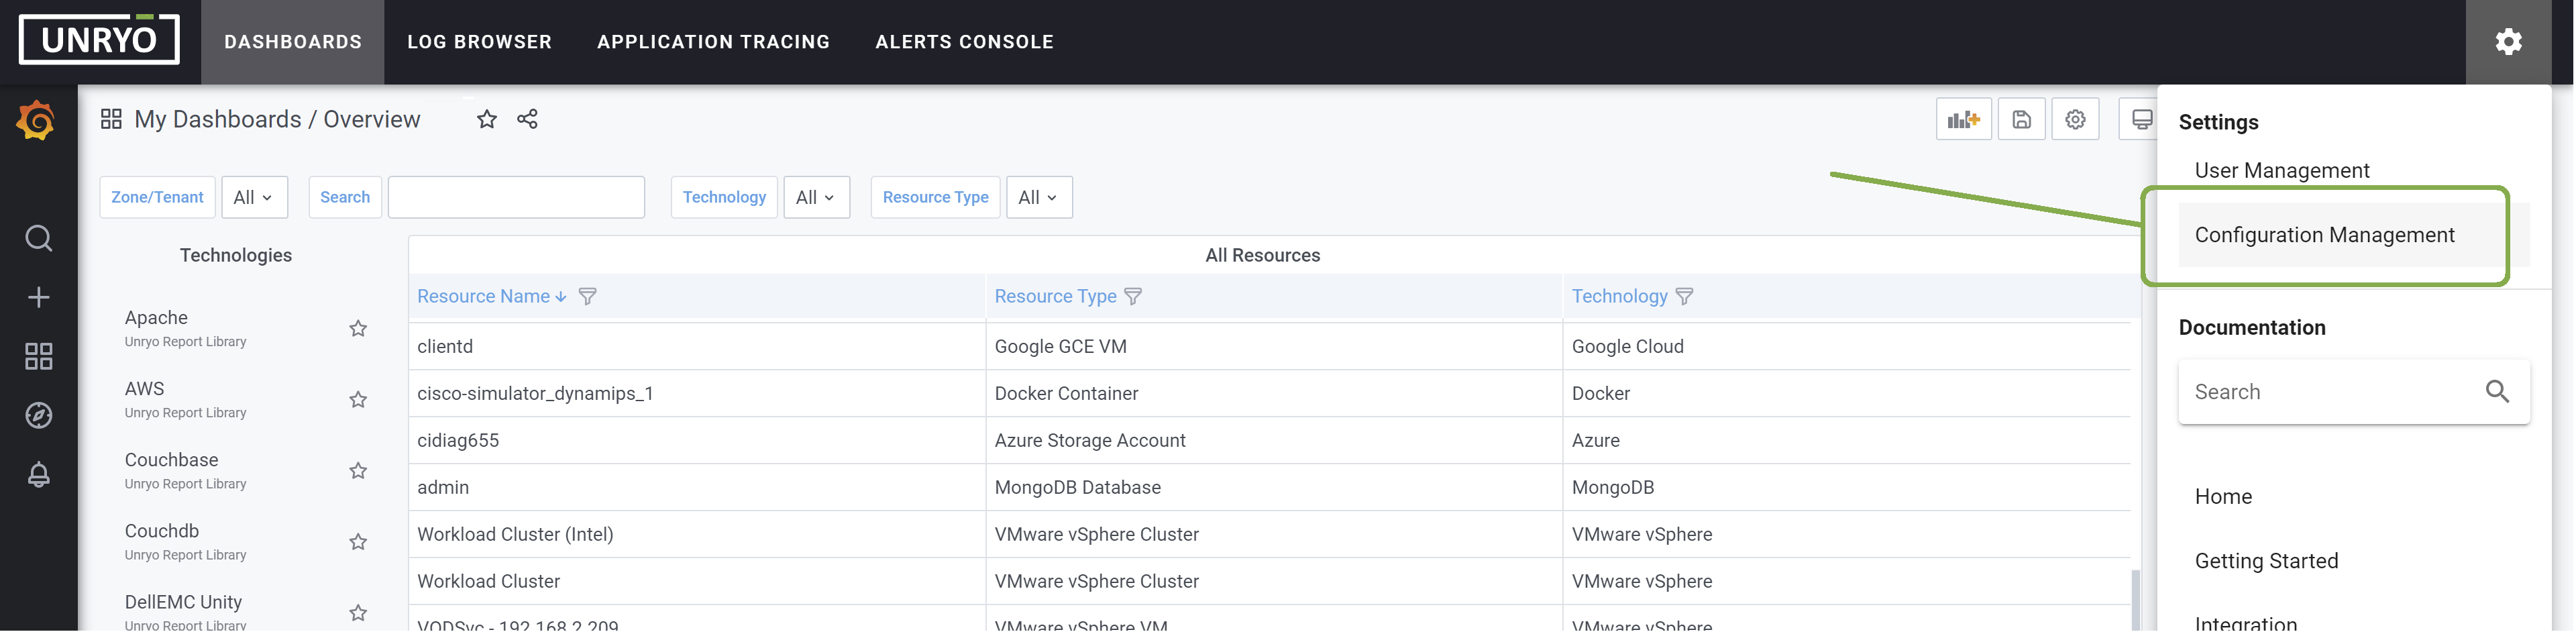
Activating the data collection#
Go in Configuration Management.
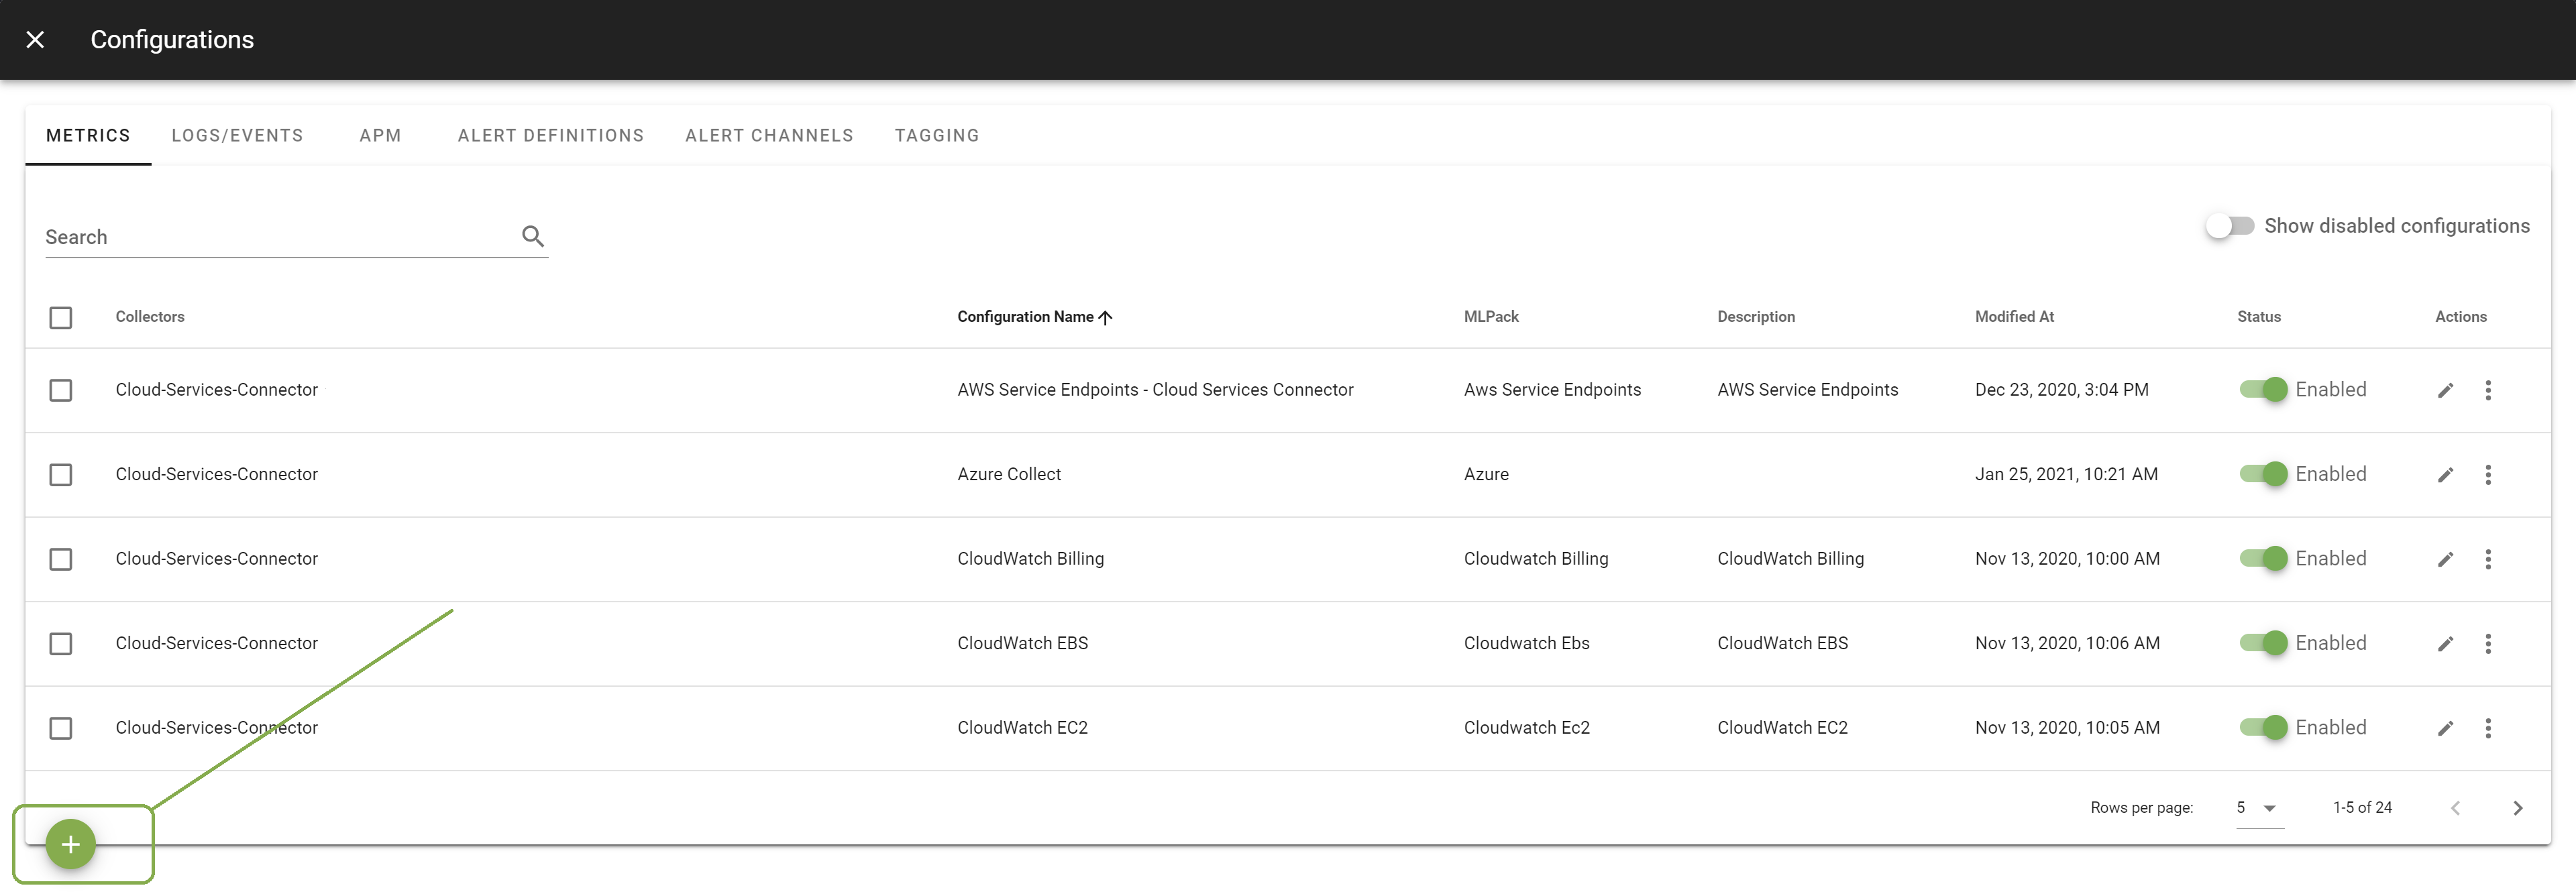
Click on the + button to add a new configuration.
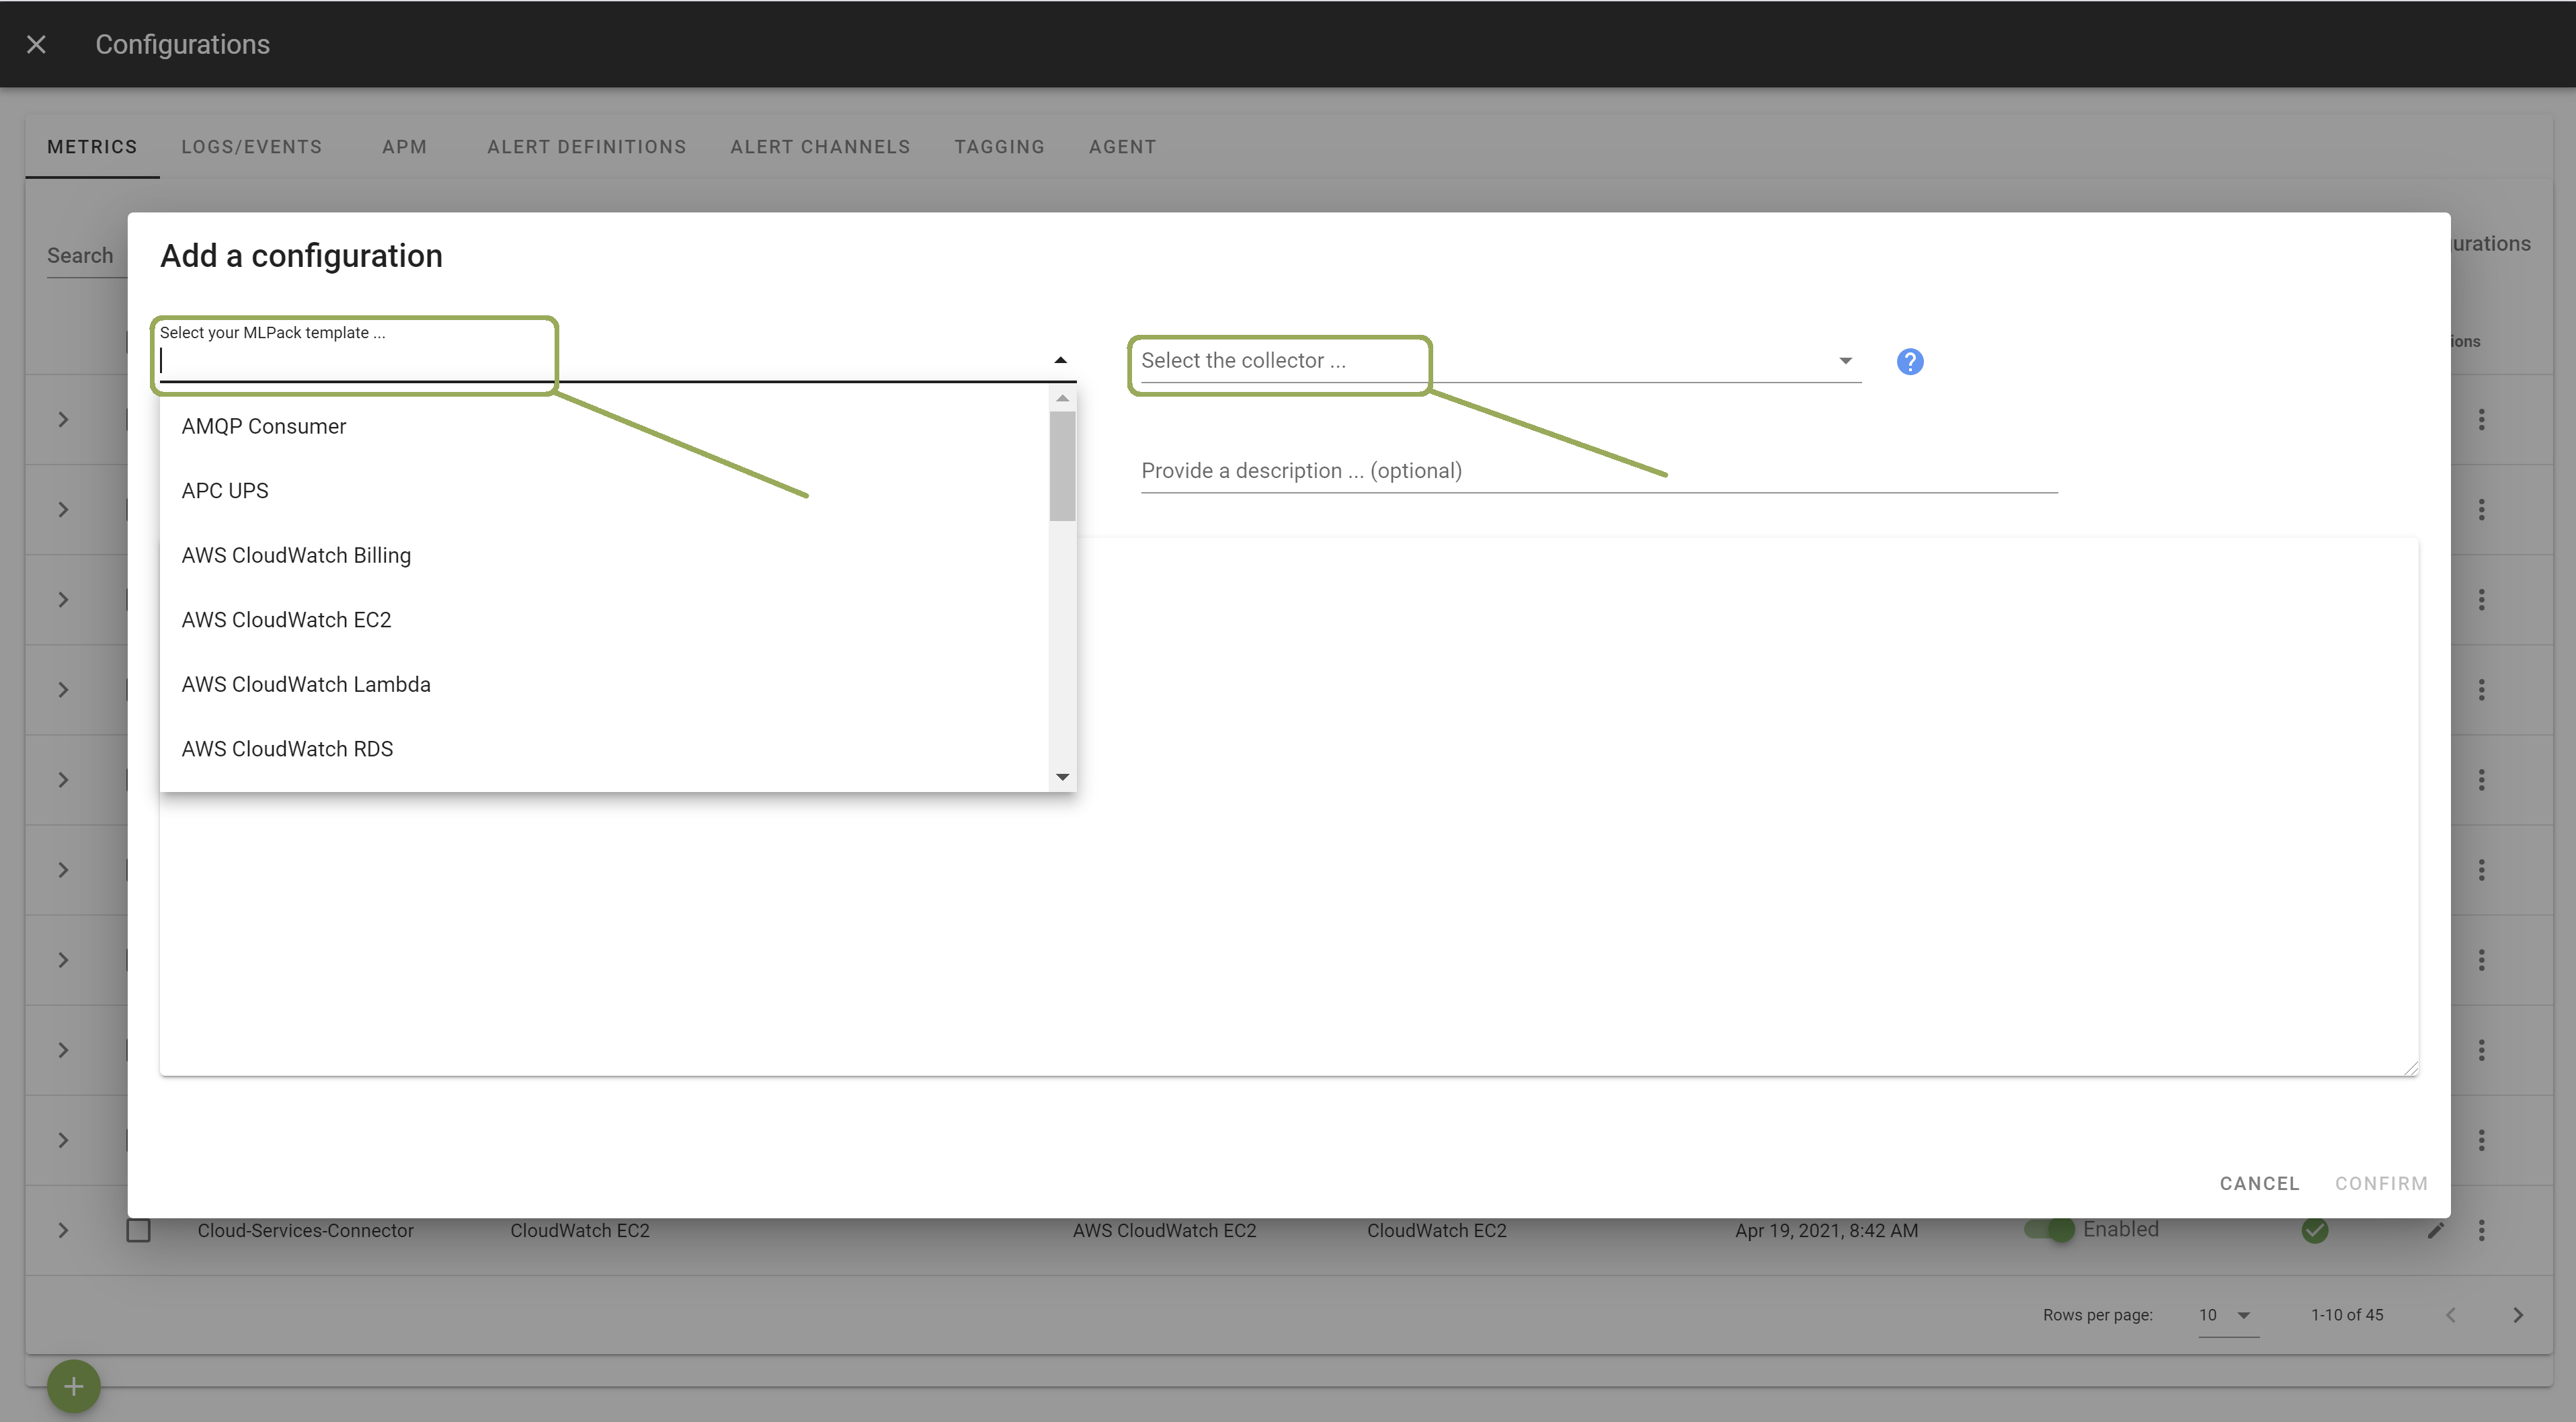
Select the template Nginx.
Note: if you use the NGINX Plus commercial version, use the template
nginx plus.
Select the Collector on which you want this configuration to be deployed; and provide a Configuration Name that is meaningful for you. The Description is optional.
In the template, enter the correct settings for your Nginx server(s). Other configuration options are possible. Browse the template to discover them.
Once done, click Apply to start the monitoring.