Microsoft Azure
Microsoft Azure#
Overview#
Unryo provides several integrations with Microsoft Azure.
At the data acquisition level, we provide:
- Collecting Azure Services Metrics via Azure Monitor.
- Collecting Azure Logs and Metrics via Azure Event Hub.
- Collecting Azure Alerts via WebHook Integration
At the data forwarding level, we provide:
- Pushing Logs and Events to Azure Event Hub.
Monitoring Azure Services#
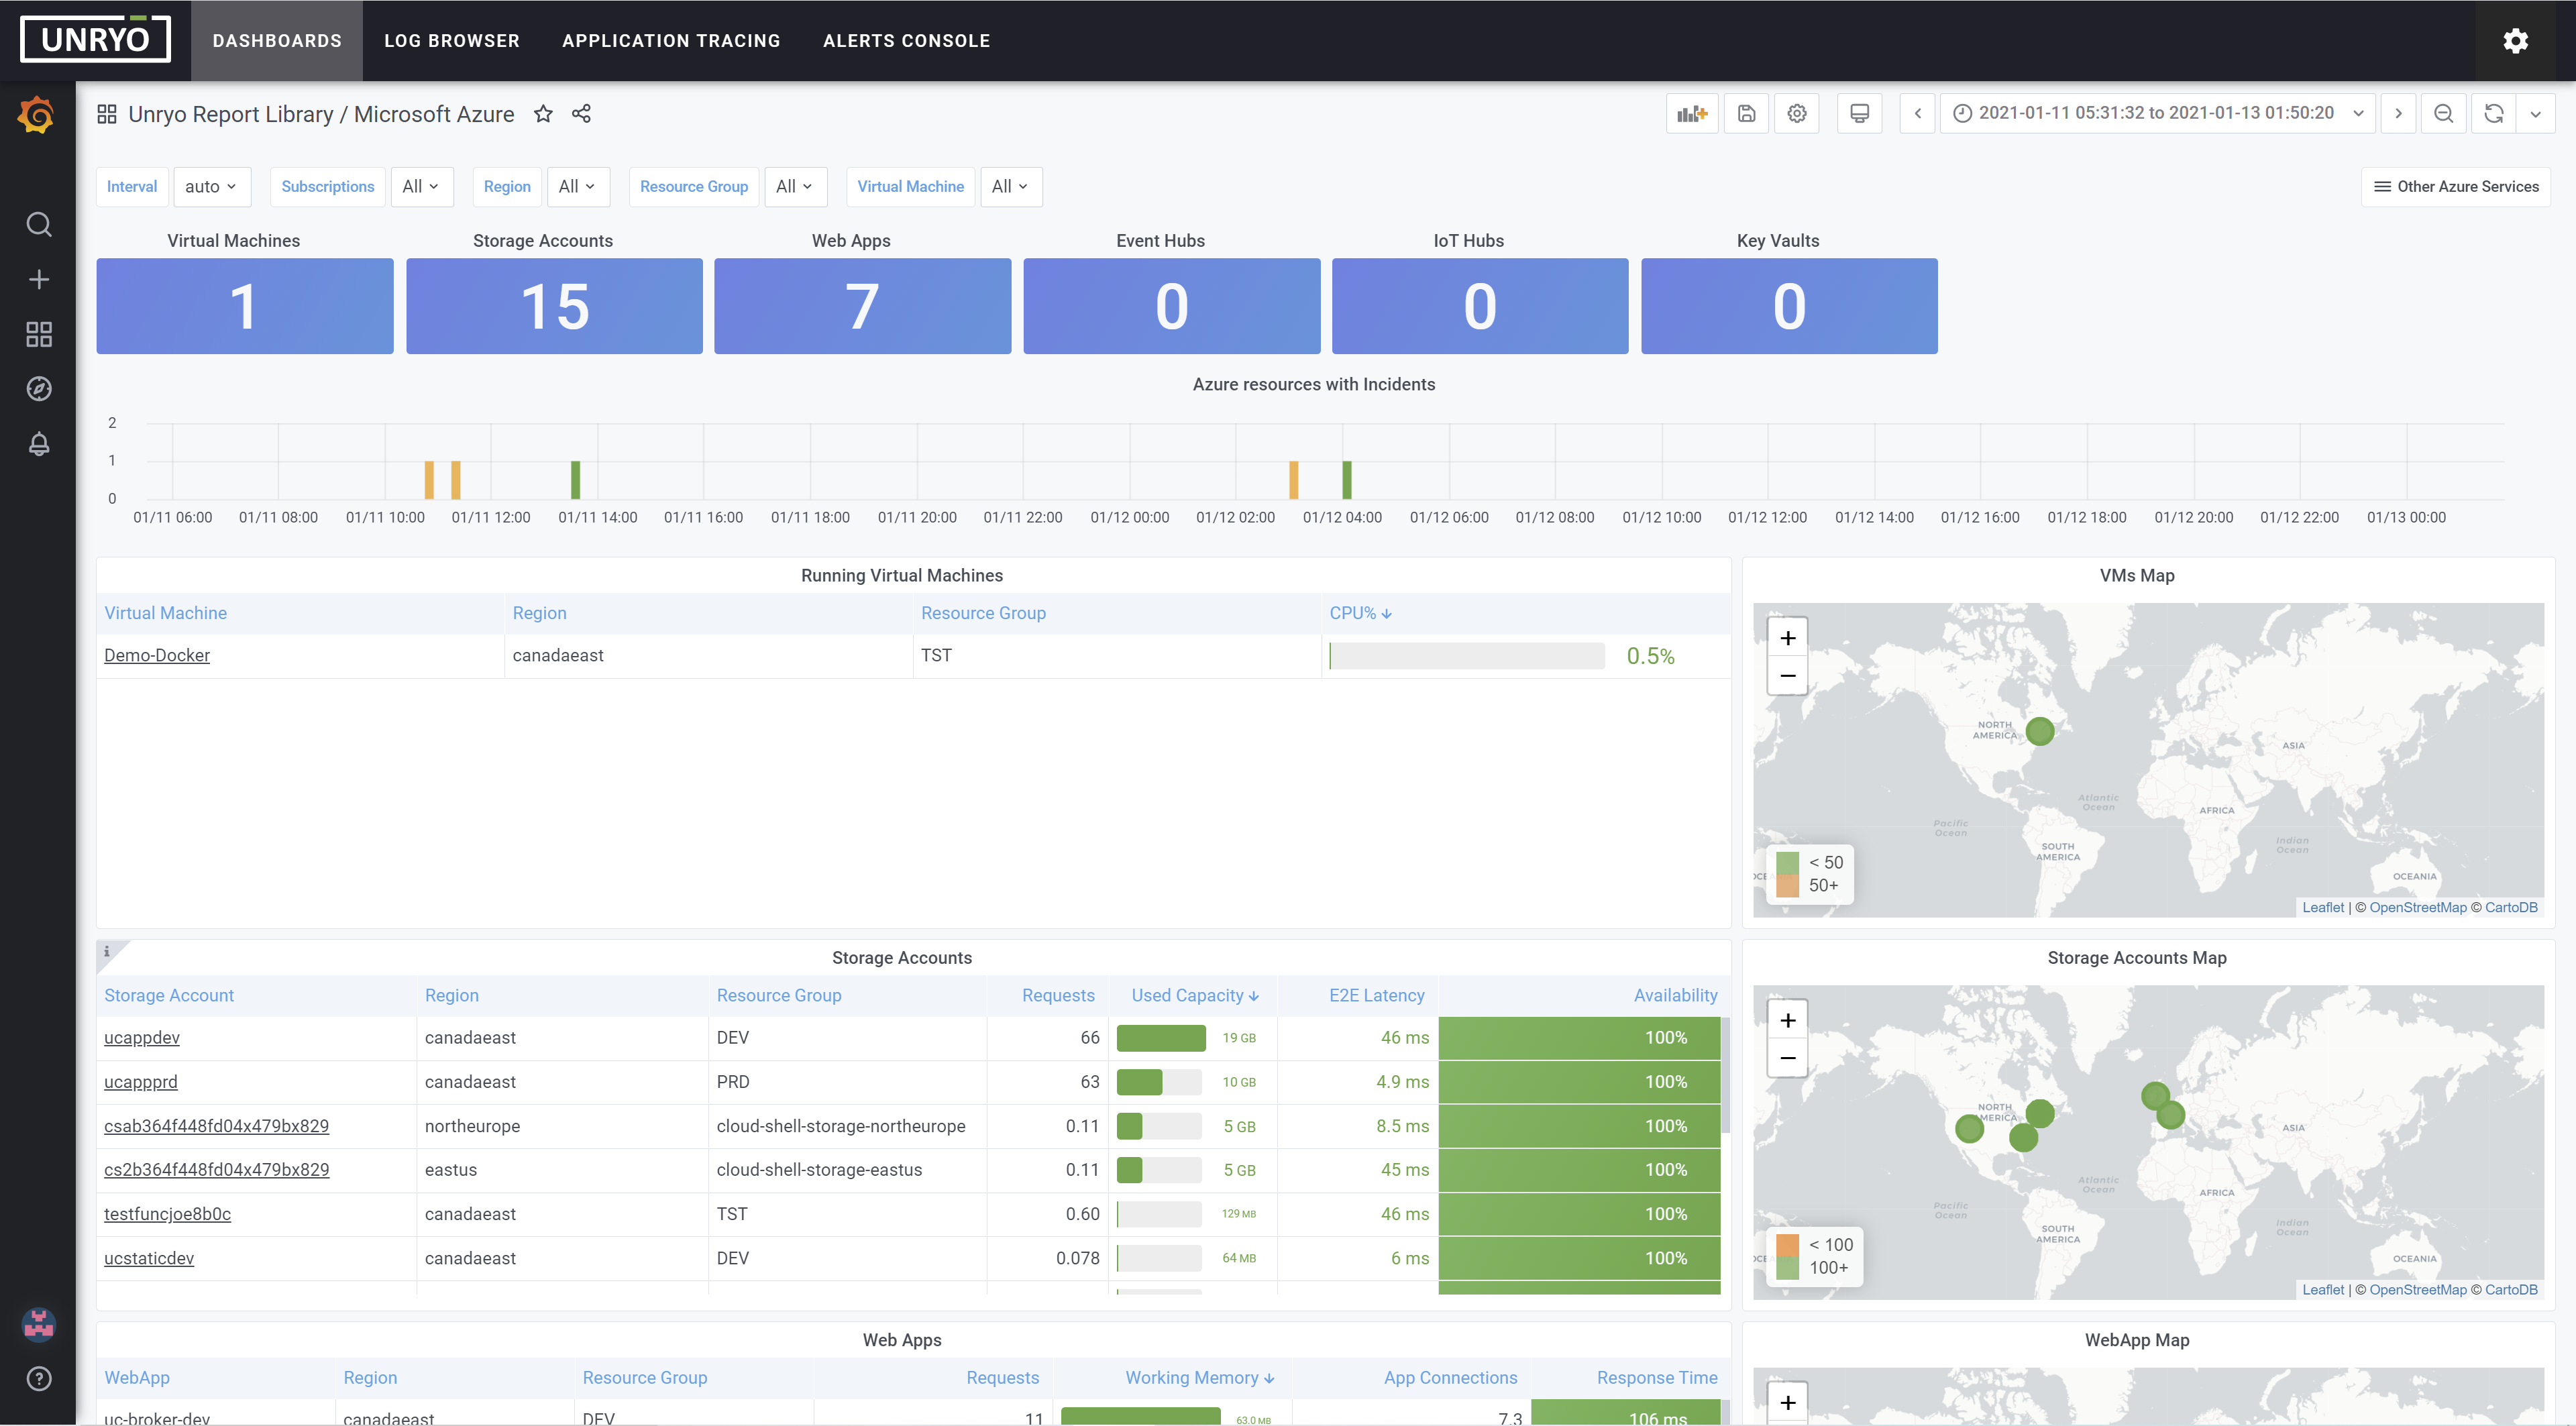
Unryo is instrumented with an Azure template that lets you collect all metrics made available by Azure Monitor. Metrics are analyzed in real-time by the Unryo Analytics Engine in order to alert when anomalies are detected. Many dashboards are available for Azure Services to view data.
Prerequisites#
To be able to pull Azure metrics, you need to: 1. Log in to your Azure portal and create an app registration 2. Add permissions for the subscriptions you want to monitor
Create an app registration#
-
Sign in to the Azure portal https://portal.azure.com/
-
Search for and select Azure Active Directory.
-
Under Manage, select App registrations > New registration.
-
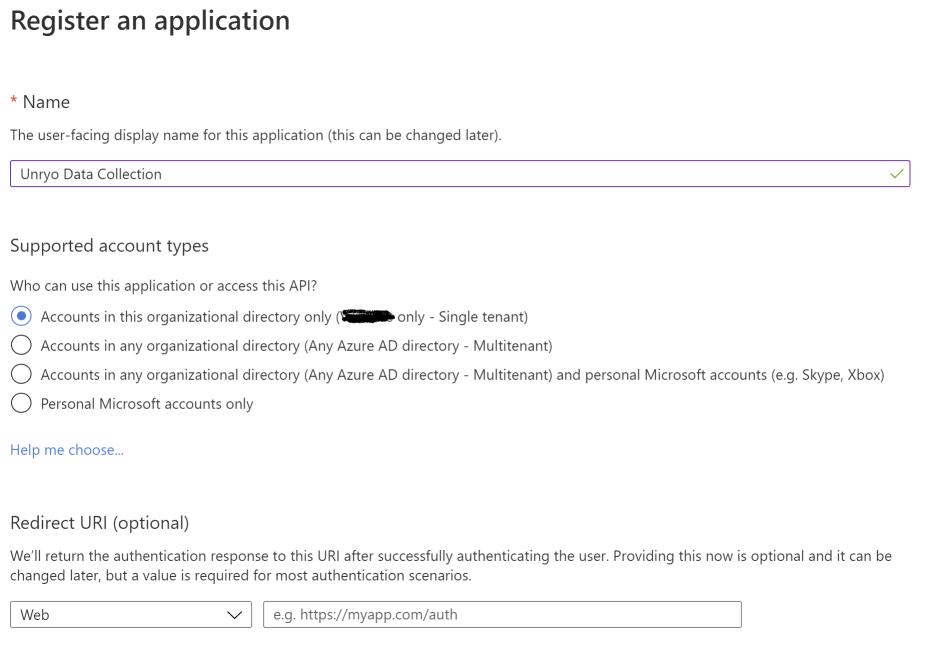
Enter a Name for your application, and the Accounts option as shown below.
-
Select Web and enter an URL (the URL is not used but is required to complete the process).
-
Click Register. Copy in clipboard the
Application (client) IDand theDirectory (tenant) ID. Save them for later use. -
Select Certificates & settings > New client secret
-
Enter a description, and set expiration to Never
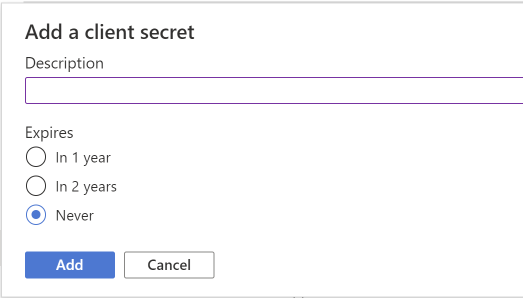
- Click Add. Copy the
Client Secret IDto clipboard and save it for later use.
Add permissions for the subscriptions#
-
Go on the Home page, select Subscriptions
-
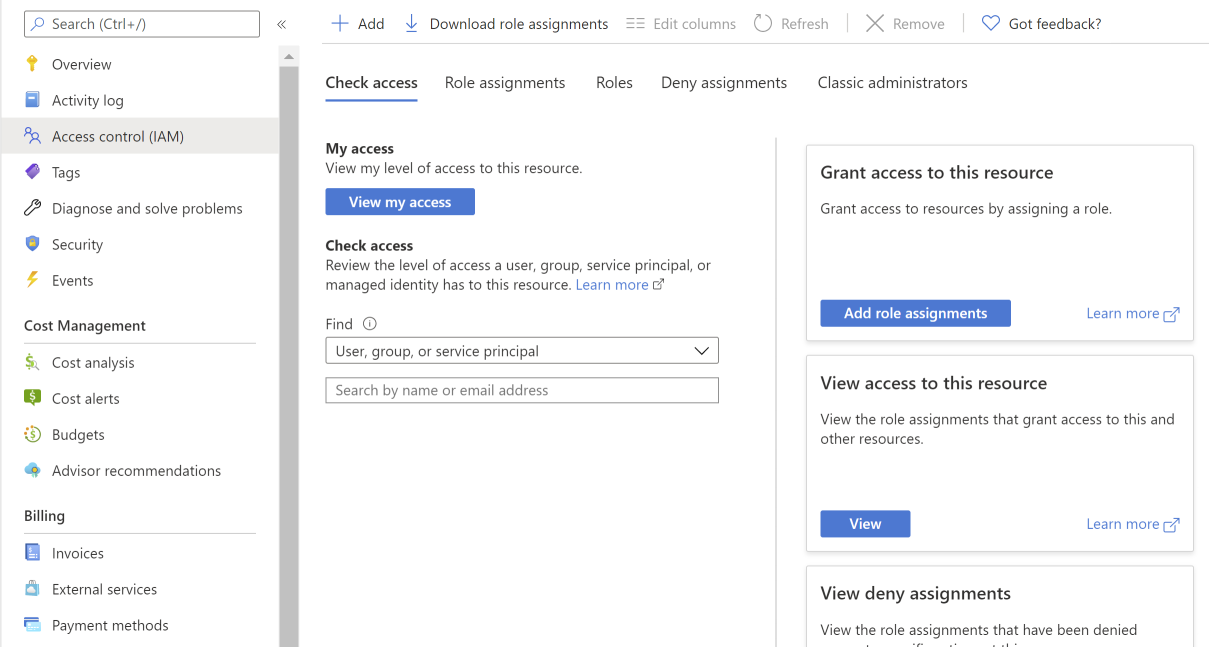
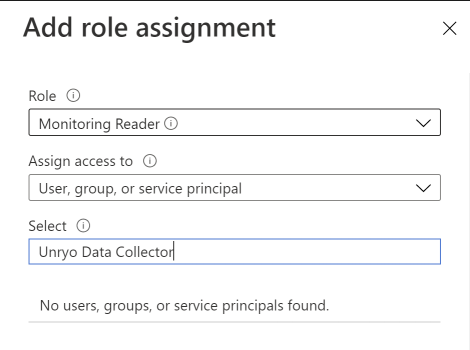
Select the subscription you want to monitor, then go to Access control (IAM) > Add role assignment
-
Under Role select
Monitoring Reader. Under Assign access selectUser, group, or service principal. -
Under Select, start typing the name of the app you previously created, and select it.
- Select Save, and repeat the steps for every subscription you want to monitor.
Configuration#
Go in Configuration Management.
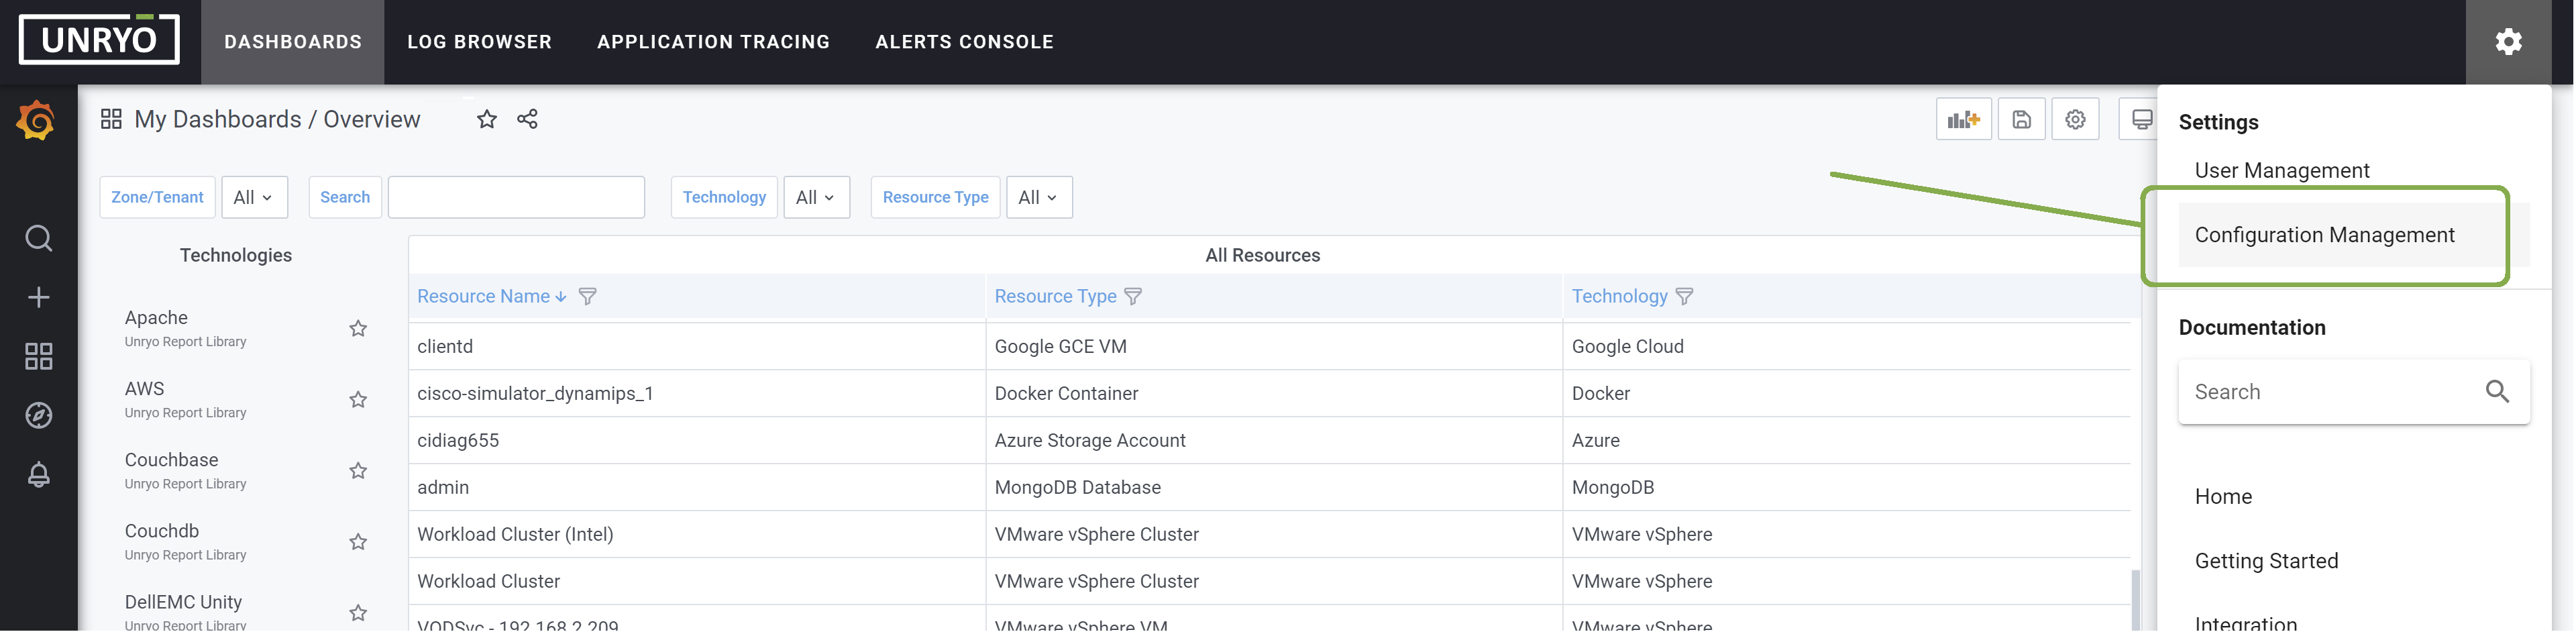
Click on the + button to add a new configuration.
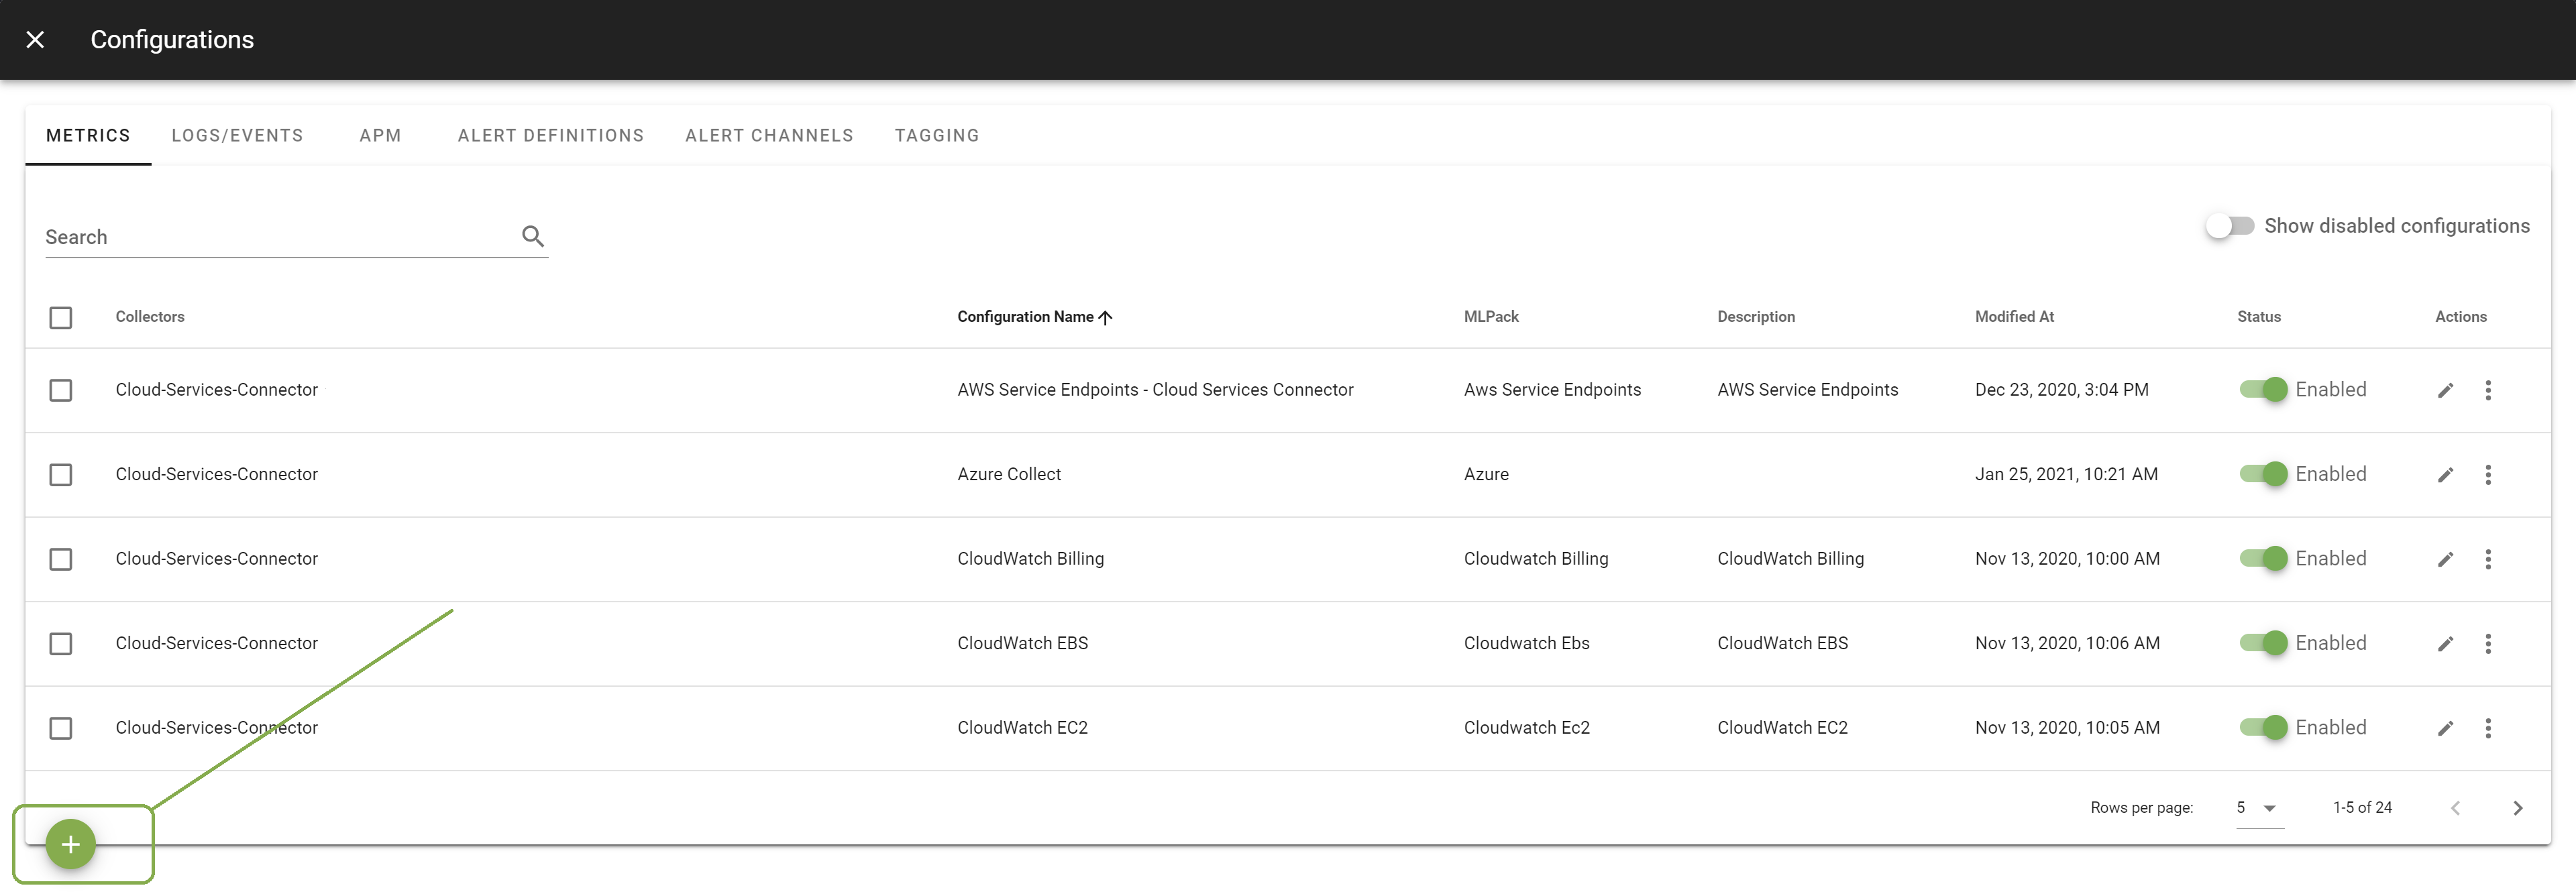
Select the Azure template. Select the Collector on which you want this configuration to be deployed; and provide a Configuration Name that is meaningful for you. The Description is optional.
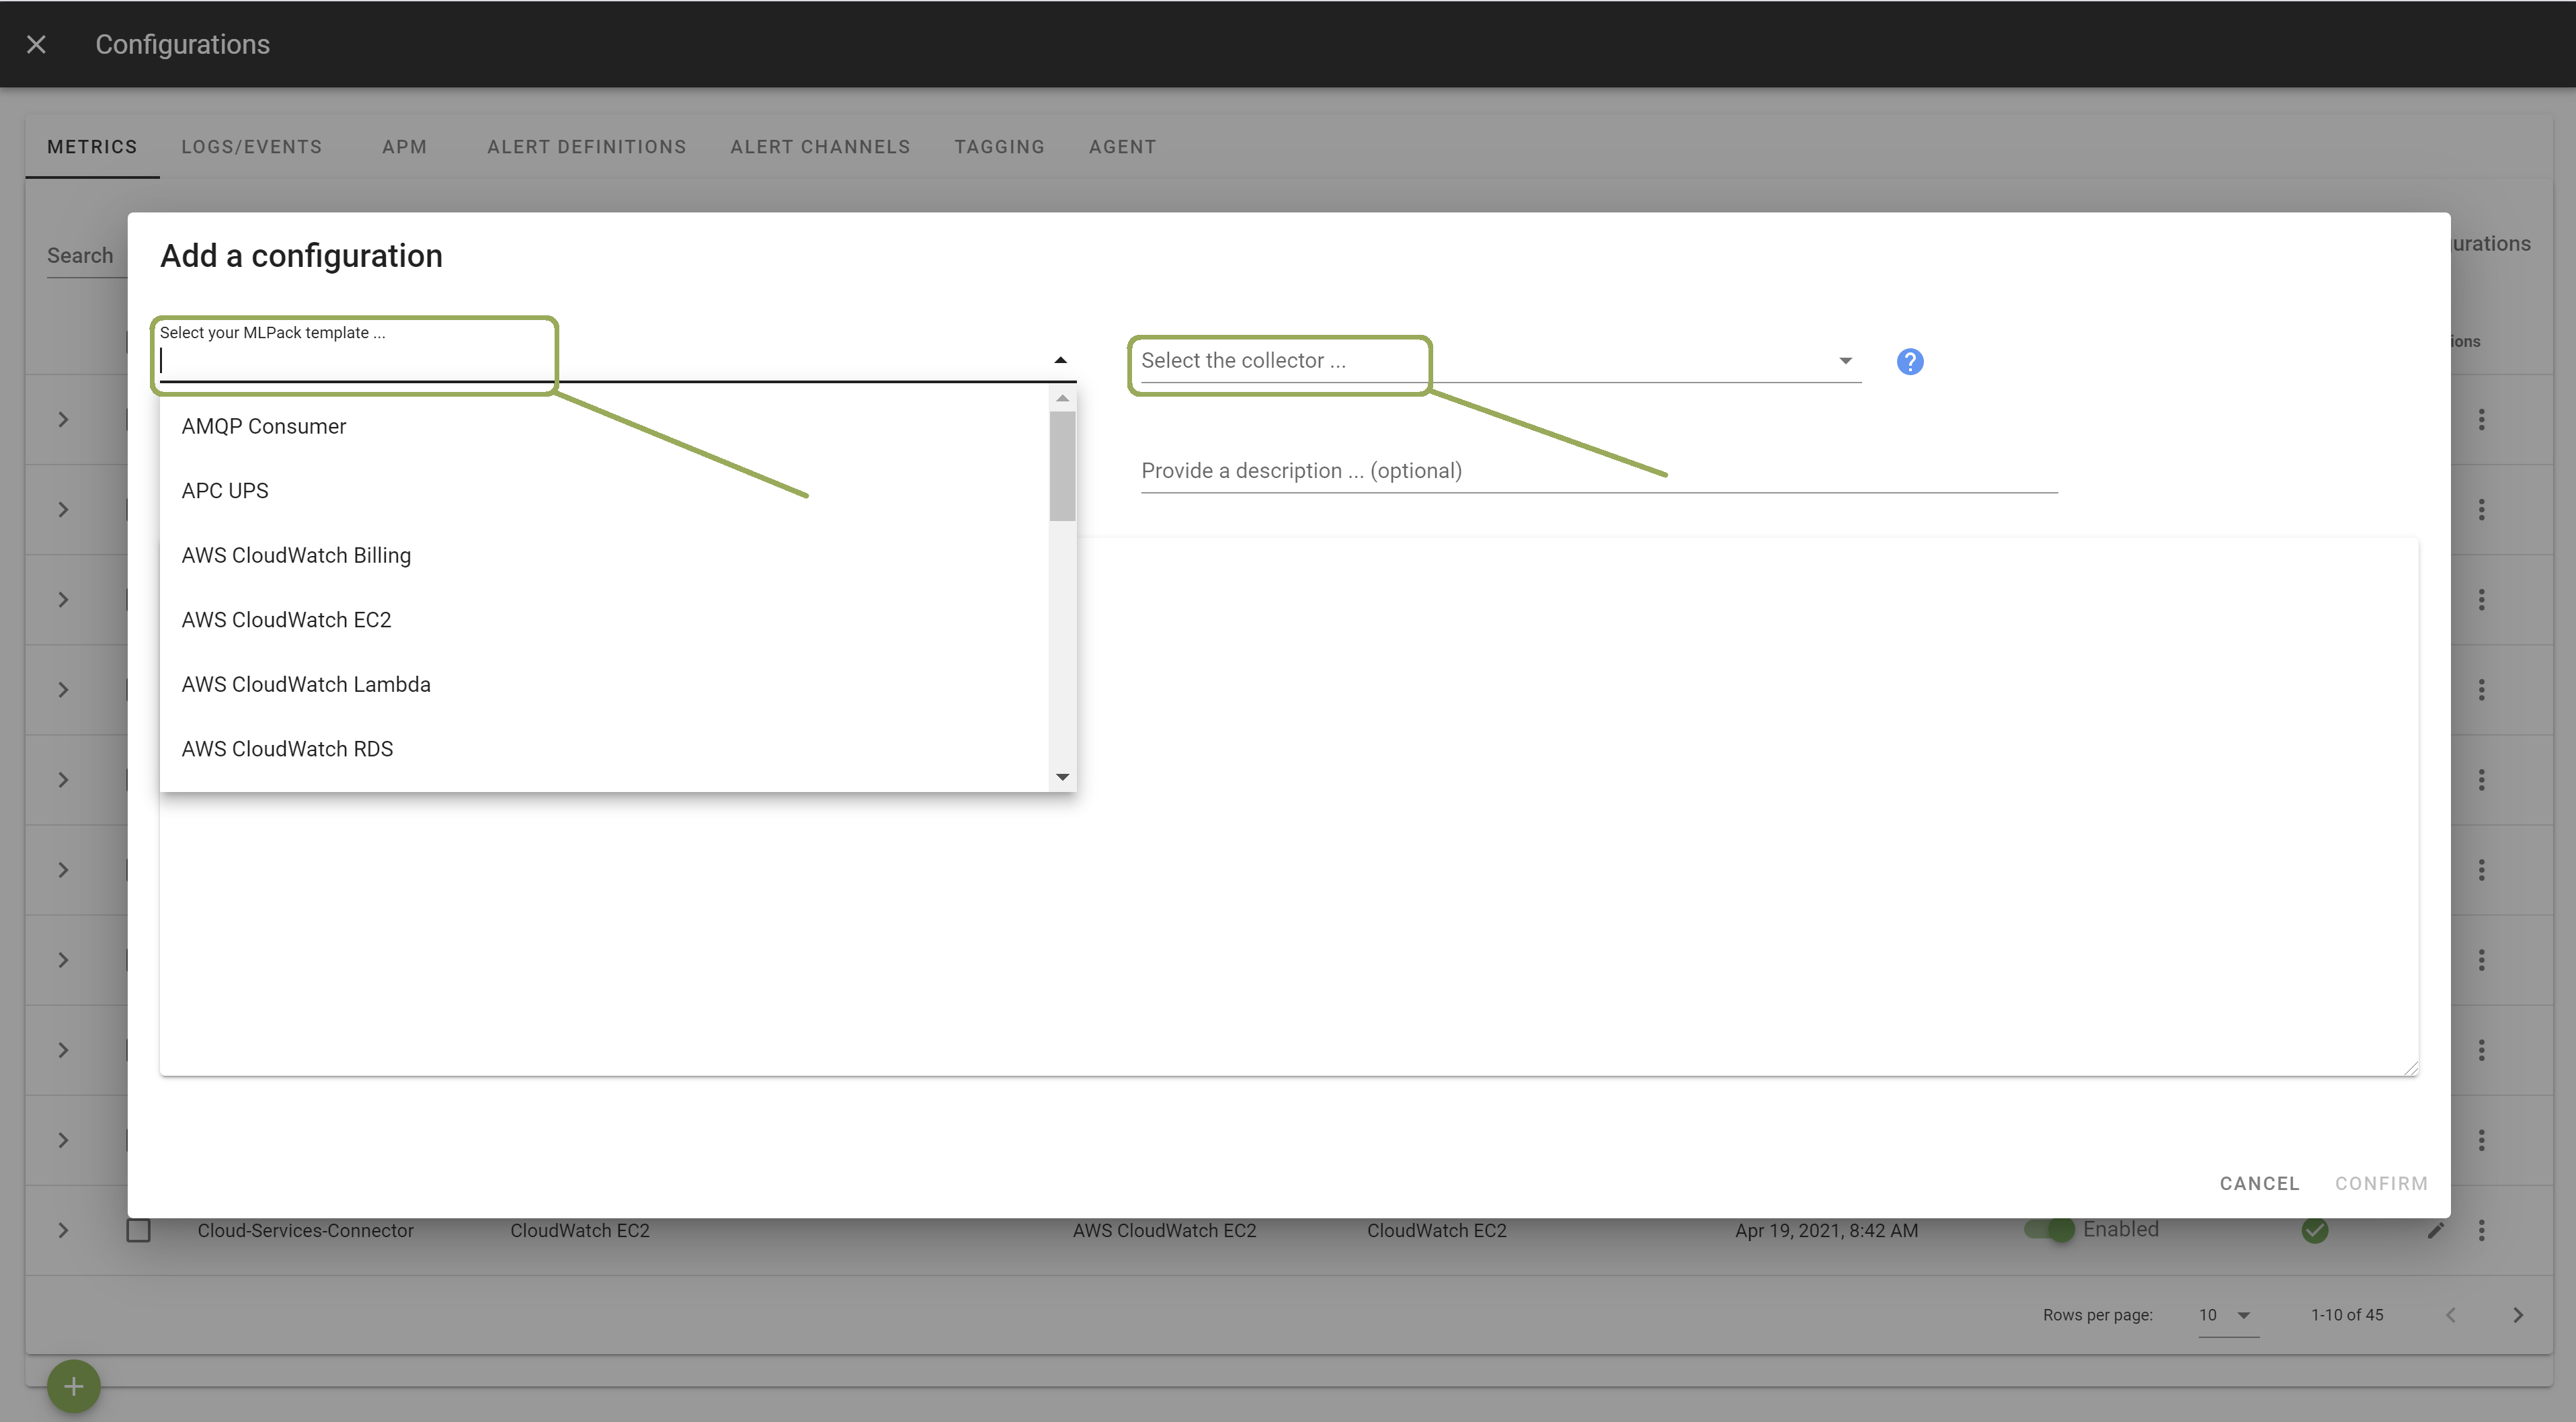
In the template, enter the correct settings. Note that you can either set your Azure settings as environment variables (as shown in the template) of the collector container; or pass them directly in the ruby command. Other configuration options are possible. Browse the template to discover them.
Once done, click Apply to start the monitoring.
Metrics#
By default the collected metrics are :
- Microsoft.Compute/disks
- Microsoft.Compute/virtualMachines
- Microsoft.Devices/IotHubs
- Microsoft.EventHub/clusters
- Microsoft.EventHub/namespaces
- Microsoft.KeyVault/vaults
- Microsoft.Storage/storageAccounts
- Microsoft.Web/sites
- And more.
Tags#
The Unryo collector will collect extra tags you have defined in an azure resource.
Command#
In the template, under the command arguments, you will see an array of commands that will be executed by the template. Let's dive into the commands.
$ /usr/bin/ruby /opt/azure_poller/azure_poller.rb \
    --tenant-id <tenant_id> \ # Required
    --sub-id <sub_id> \ # Required
    --client-id <client_id> \ # Required
    --client-secret-id <secret_id> \ # Required
    --resource-type Microsoft.Compute/virtualMachines \ # Required
    --measurement-name azure-monitor-vm" # Will be the name of the measurement in the Grafana explorer
Allow metric for a given resource-type
$ /usr/bin/ruby /opt/azure_poller/azure_poller.rb \
    --tenant-id <tenant_id> \ # Required
    --sub-id <sub_id> \ # Required
    --client-id <client_id> \ # Required
    --client-secret-id <secret_id> \ # Required
    --resource-type Microsoft.Compute/virtualMachines \ # Required
    --measurement-name azure-monitor-vm" # Will be the name of the measurement in the Grafana explorer
    --allow-metrics "CPU Credits Consumed","CPU Credits Remaining" # List of metrics that you want to gather
Each resource-type has its own metrics. In this example, I allow 2 Metrics for the resoure-type Microsoft.Compute/virtualMachines. The script will return only the 2 metrics related to the resource-type. The list of metrics can be found here.
Deny metric for a given resource-type
It's possible to deny a list of metrics for a given resource-type. The --allow-metrics and --deny-metrics are mutually exclusive. You cannot define an --allow-metrics and a --deny-metrics list. The script will return an error.
$ /usr/bin/ruby /opt/azure_poller/azure_poller.rb \
    --tenant-id <tenant_id> \ # Required
    --sub-id <sub_id> \ # Required
    --client-id <client_id> \ # Required
    --client-secret-id <secret_id> \ # Required
    --resource-type Microsoft.Compute/virtualMachines \ # Required
    --measurement-name azure-monitor-vm" \ # Will be the name of the measurement in the Grafana explorer
    --deny-metrics "CPU Credits Consumed","CPU Credits Remaining" # List of metrics you want to exclude
This example will include all the metrics that are not "CPU Credits Consumed" and "CPU Credits Remaining"
Deny custom tags for a given resource-type
$ /usr/bin/ruby /opt/azure_poller/azure_poller.rb \
    --tenant-id <tenant_id> \ # Required
    --sub-id <sub_id> \ # Required
    --client-id <client_id> \ # Required
    --client-secret-id <secret_id> \ # Required
    --resource-type Microsoft.Compute/virtualMachines \ # Required
    --measurement-name azure-monitor-vm" \ # Will be the name of the measurement in the Grafana explorer
    --deny-tags "test","staging" # List of metrics you want to exclude
The script will ignore the test and staging tags
Collect no tags for a given resource-type
$ /usr/bin/ruby /opt/azure_poller/azure_poller.rb \
    --tenant-id <tenant_id> \ # Required
    --sub-id <sub_id> \ # Required
    --client-id <client_id> \ # Required
    --client-secret-id <secret_id> \ # Required
    --resource-type Microsoft.Compute/virtualMachines \ # Required
    --measurement-name azure-monitor-vm" \ # Will be the name of the measurement in the Grafana explorer
    --no-tags # Will ignore all the custom tags
This script will ignore all the custom tags
Collecting Azure Log and Event#
Prerequisites#
-
Create an Event Hub. As described here.
-
Set up an Event Hub shared access policy.
-
From portal.azure.com, navigate to your Event Hub.
- Click on Shared Access Policies on the menu on the left, under the Settings section.
- Click on + Add at the top of the page section that opened up.
-
Give your policy and name and select Listen in the menu that appeared on the right, and click on Create at the bottom of the menu.
-
(optional) Create an Event Hub Consumer Group.
-
From portal.azure.com, navigate to your Event Hub.
- Click on Consumer groups on the menu on the left, under the Entities section.
- Click on + Consumer group at the top of the page section that opened up.
-
Give your consumer group a name and click on Create at the bottom of menu that appeared on the right.
-
Send logs and events from other Azure Services to Event Hub.
Configuration#
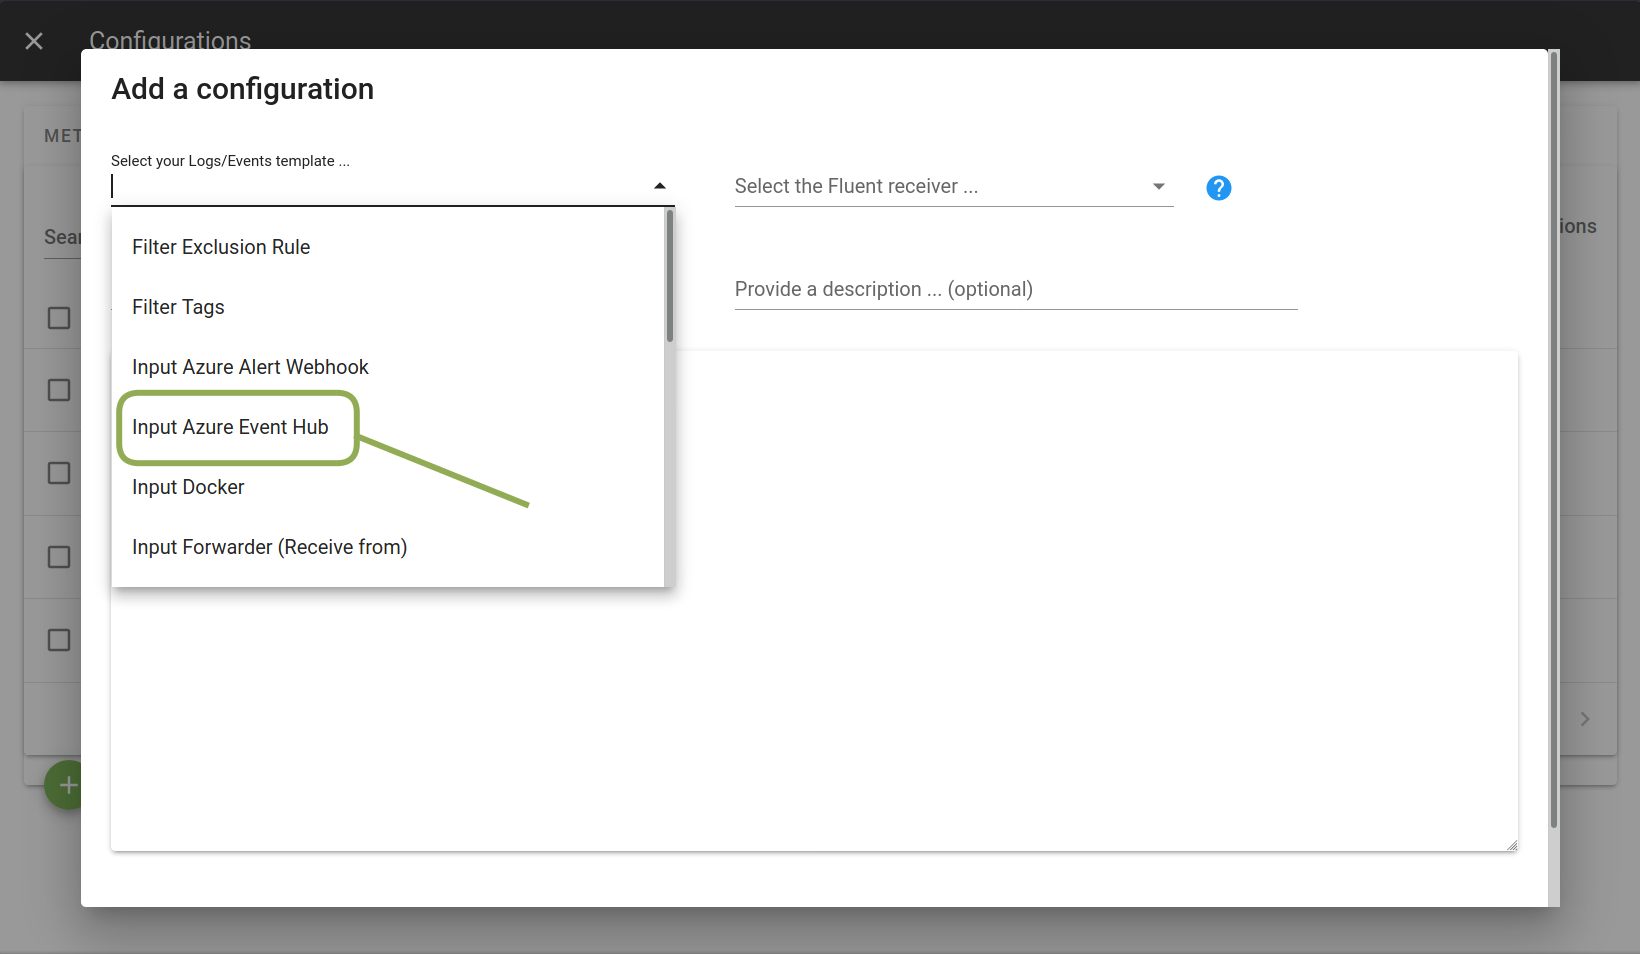
Go to the Logs/Events tab in Configuration Management.
Click on the + button to add a new configuration.
Select the Input Azure Event Hub template. Select the Receiver on which
you want this configuration to be deployed; and provide a Configuration Name
that is meaningful for you. The Description is optional.
Note that Azure Event Hub makes its data available as though it were a Kafka
server, hence @type kafka_group in this configuration file.
Replace YOUR-EVENT-HUB-NAMESPACE with the Event Hub Namespace containing
your Event Hub.
Replace YOUR-CONSUMER-GROUP-NAME with your Event Hub Consumer Group name. If
you did not create one, use '$Default'.
Replace YOUR-EVENT-HUB-NAME with your Event Hub's name.
Lastly, replace YOUR-CONNECTION-STRING-PRIMARY-KEY with the Connection
String Primary Key. You can retrieve it by navigating to where you created
your shared access policy, as described above, and clicking on the name of
the shared access policy you wish to use; a menu containing the connection
string primary key will appear.
Click Apply when you are done.
Pushing Logs and Events to Azure Event Hub#
-
Create an Event Hub. As described here.
-
Set up an Event Hub shared access policy.
-
From portal.azure.com, navigate to your Event Hub.
- Click on Shared Access Policies on the menu on the left, under the Settings section.
- Click on + Add at the top of the page section that opened up.
-
Give your policy and name and select Send in the menu that appeared on the right, and click on Create at the bottom of the menu.
-
Send logs and events from other Azure Services to Event Hub.
Configuration#
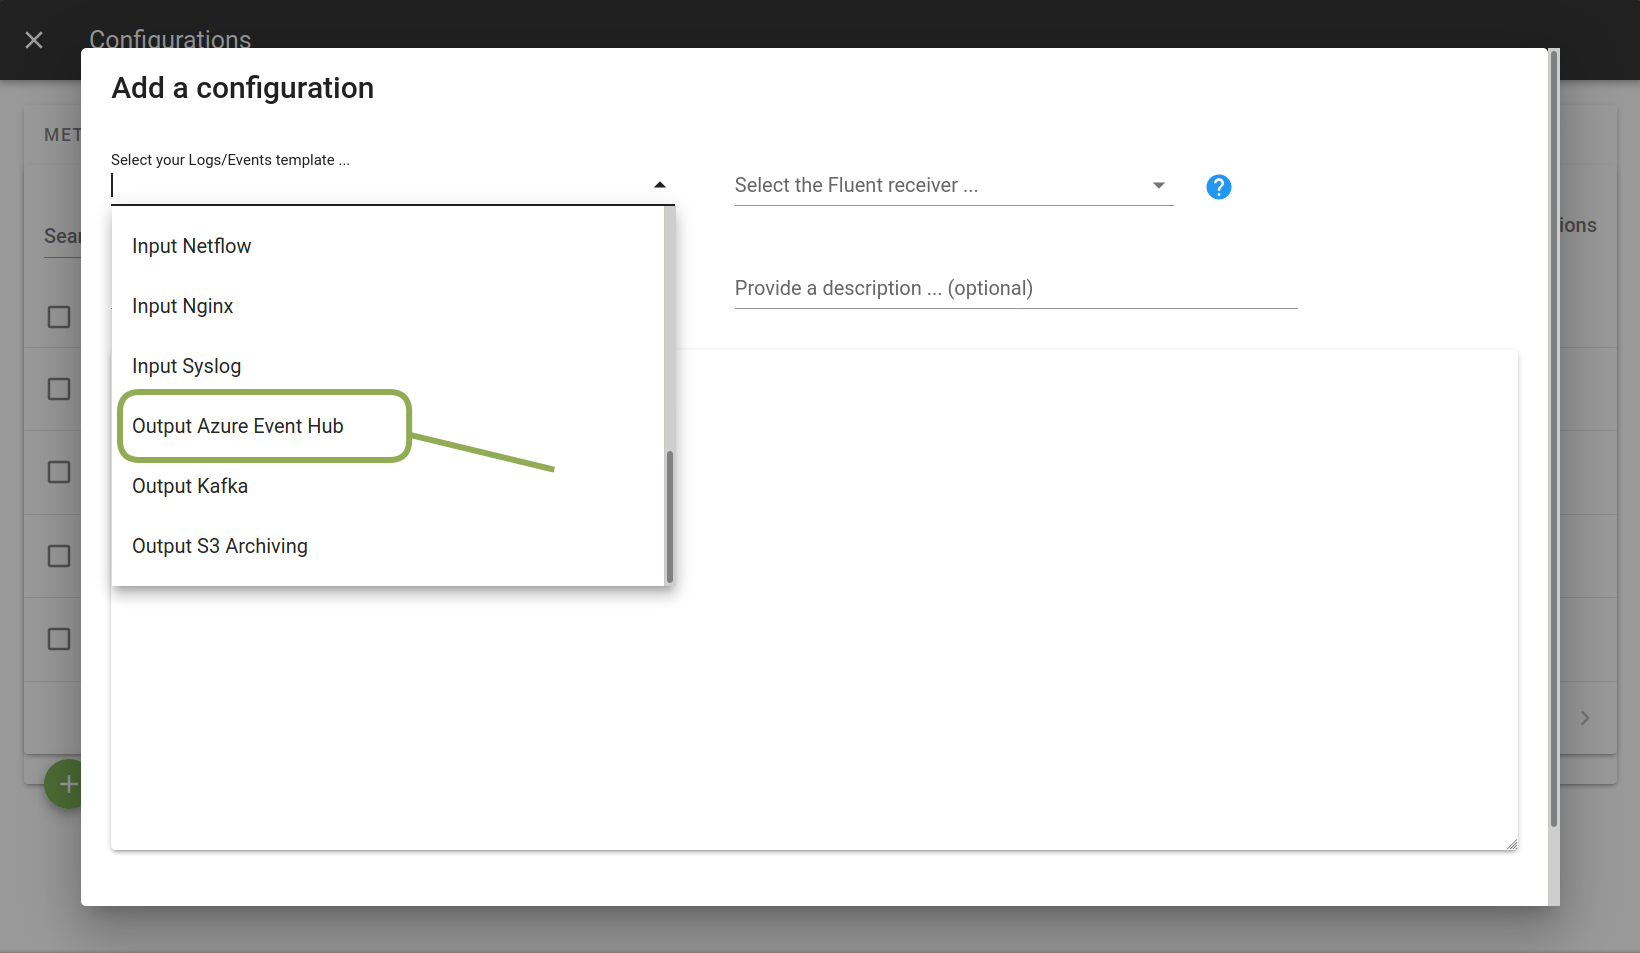
Go to the Logs/Events tab in Configuration Management.
Click on the + button to add a new configuration.
Select the Output Azure Event Hub template. Select the Receiver on which
you want this configuration to be deployed; and provide a Configuration Name
that is meaningful for you. The Description is optional.
Note that Azure Event Hub can receive data as if it were a Kafka node, hence
@type kafka2 in this configuration file.
Replace YOUR-EVENT-HUB-NAMESPACE with the Event Hub Namespace containing
your Event Hub.
Replace YOUR-EVENT-HUB-NAME with your Event Hub's name.
Lastly, replace YOUR-CONNECTION-STRING-PRIMARY-KEY with the Connection
String Primary Key. You can retrieve it by navigating to where you created
your shared access policy, as described above, and clicking on the name of
the shared access policy you wish to use; a menu containing the connection
string primary key will appear.
Click Apply when you are done.
Azure Alert Webhook Collection#
Prerequisites#
-
Create an Azure Alert Rule, As described here once the alert rule is created you will need to add a webhook action to this rule.
-
Create a webhook action As described here.
-
Specify your host url into the webhook
URI.
Configuration#
Go to the Logs/Events tab in Configuration Management.
Click on the + button to add a new configuration.
Select the Azure Alert Webhook Input
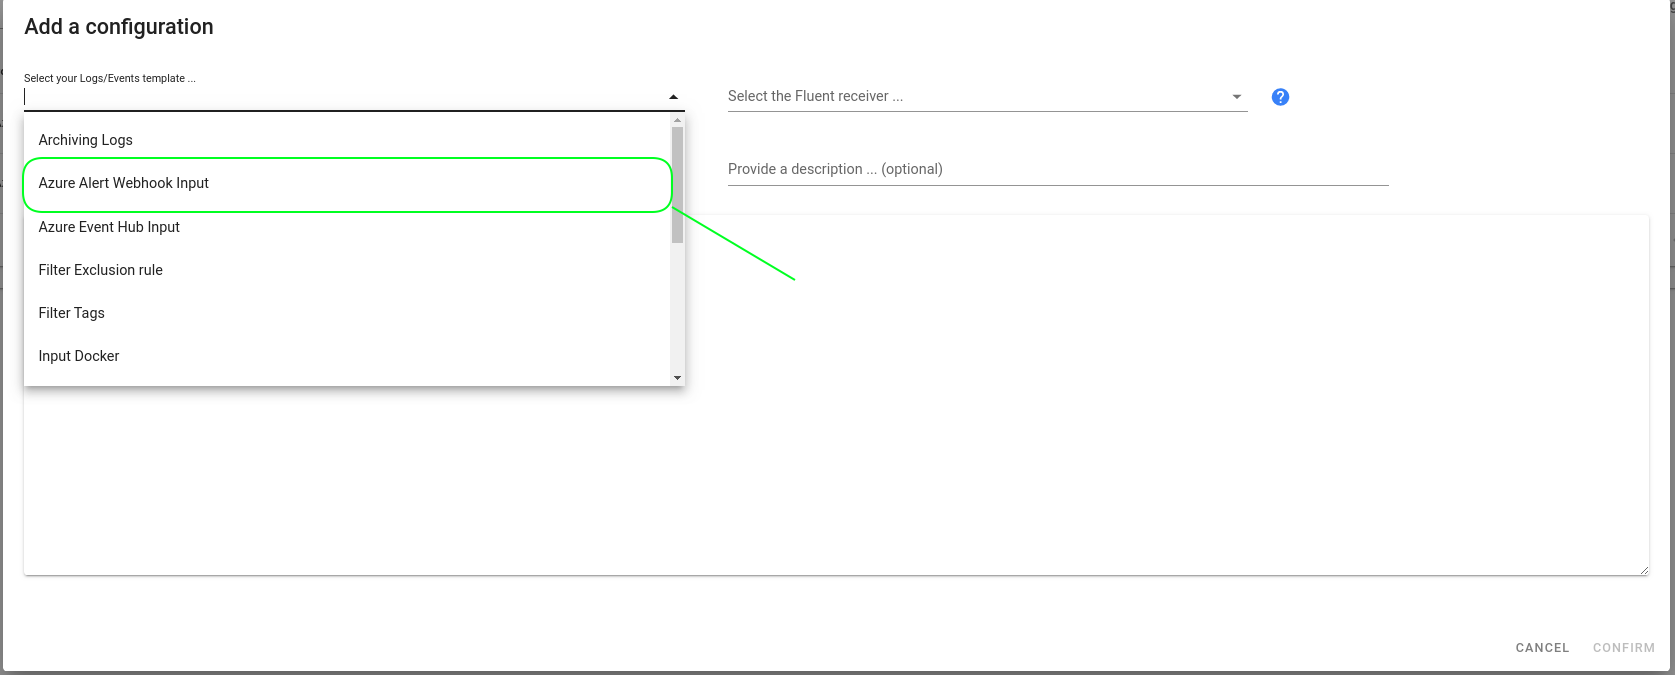
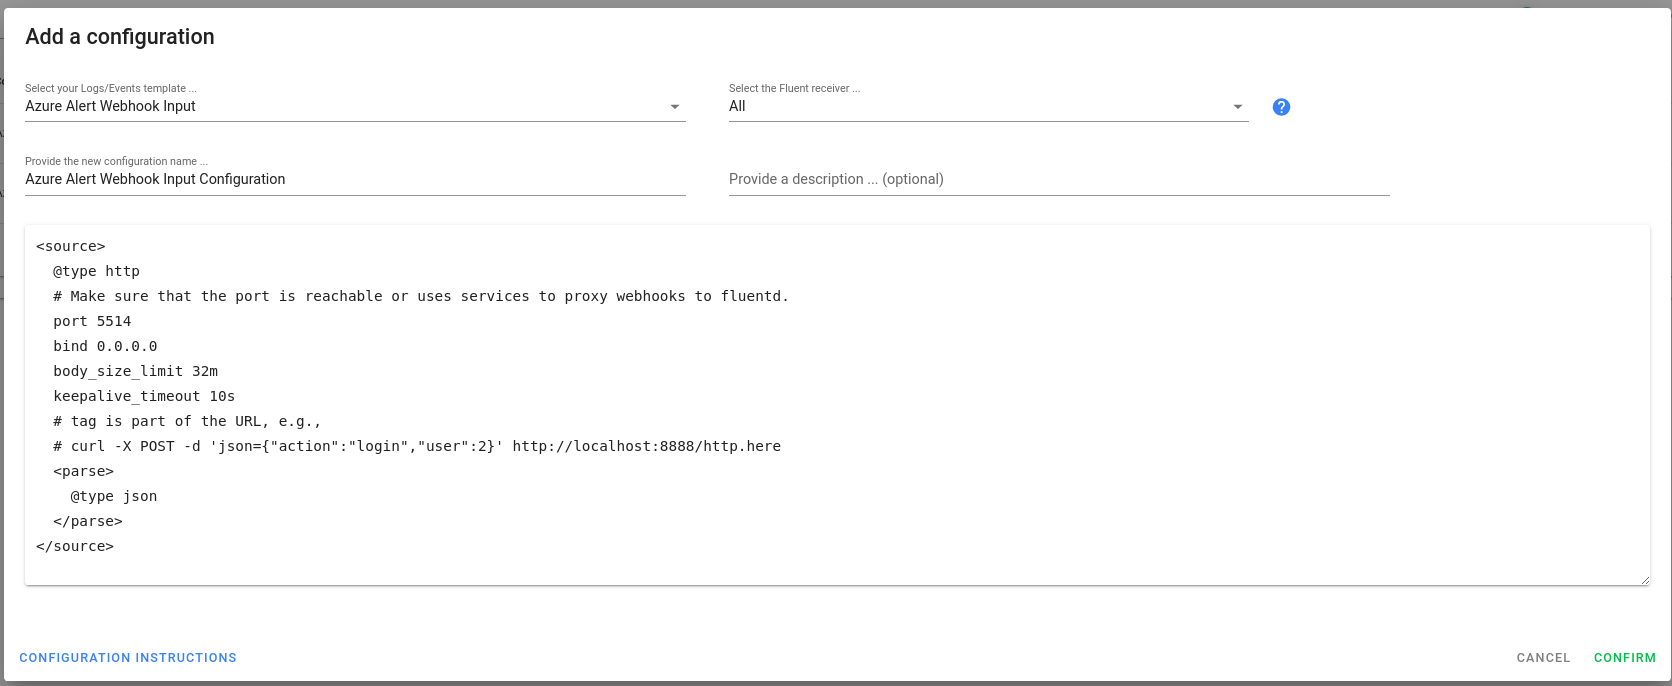
Click Confirm to create the configuration.
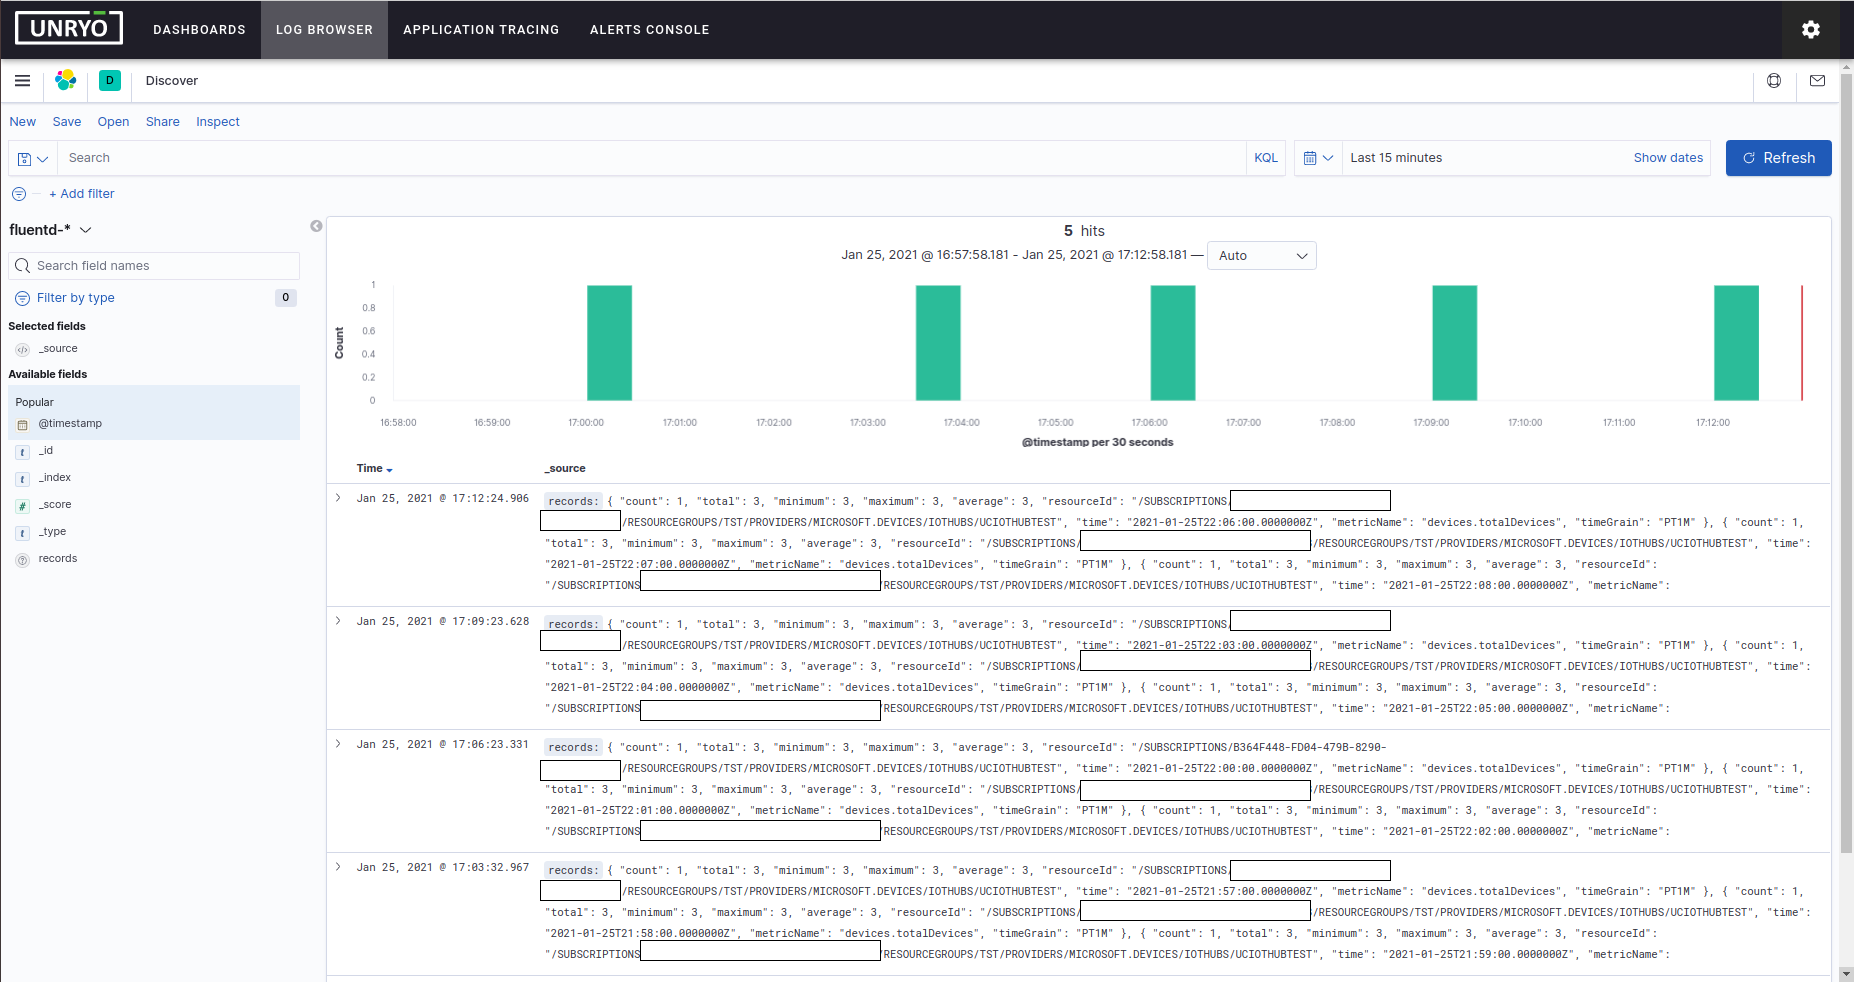
Note: Make sure that the port specified in the configuration is reachable or uses services to proxy webhooks to fluentd.
Once the configuration is applied to fluentd, the alert webhook logs will be stored in the Log Event database. You can see your log data into the Log Management tab.