VMware Vsphere
VMware Vsphere#
Overview#
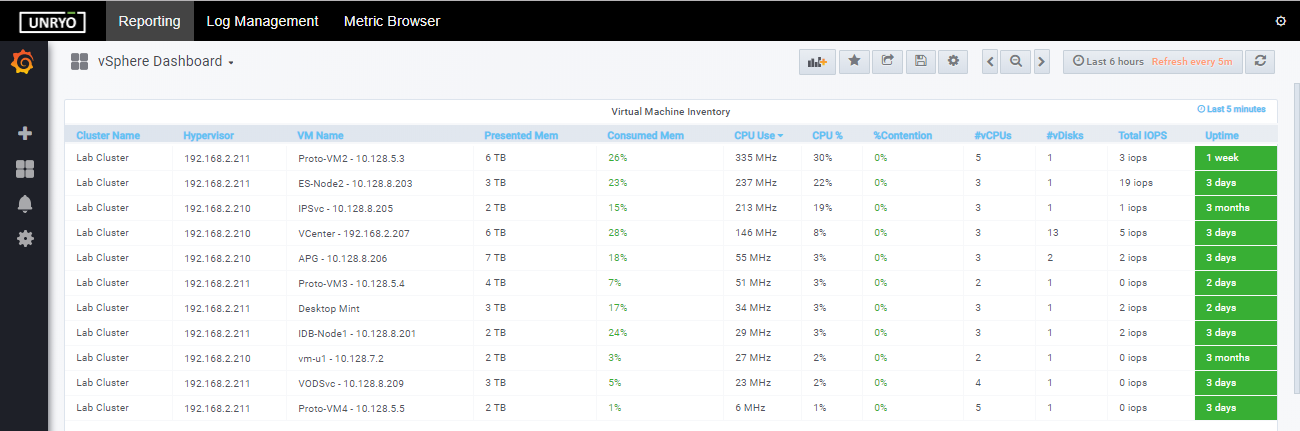
The ML Pack for VMware vSphere tells you how the virtual machines affect the performance of your applications and services, and offers out-of-the-box dashboards and reporting capabilities:
- High Level Dashboard for Storages/Hypervisors/Virtual Machines
- Inventory reporting for Storages/Hypervisors/Virtual Machines
- Precision reports for Virtual Machine
- Precision reports for Hypervisor
- Precision reports for Datastores
The reports are designed to help you to:
- Investigate performance problems
- Plan Capacity for compute, storage and networking
- Consolidate reporting across private and public cloud providers
Configuration#
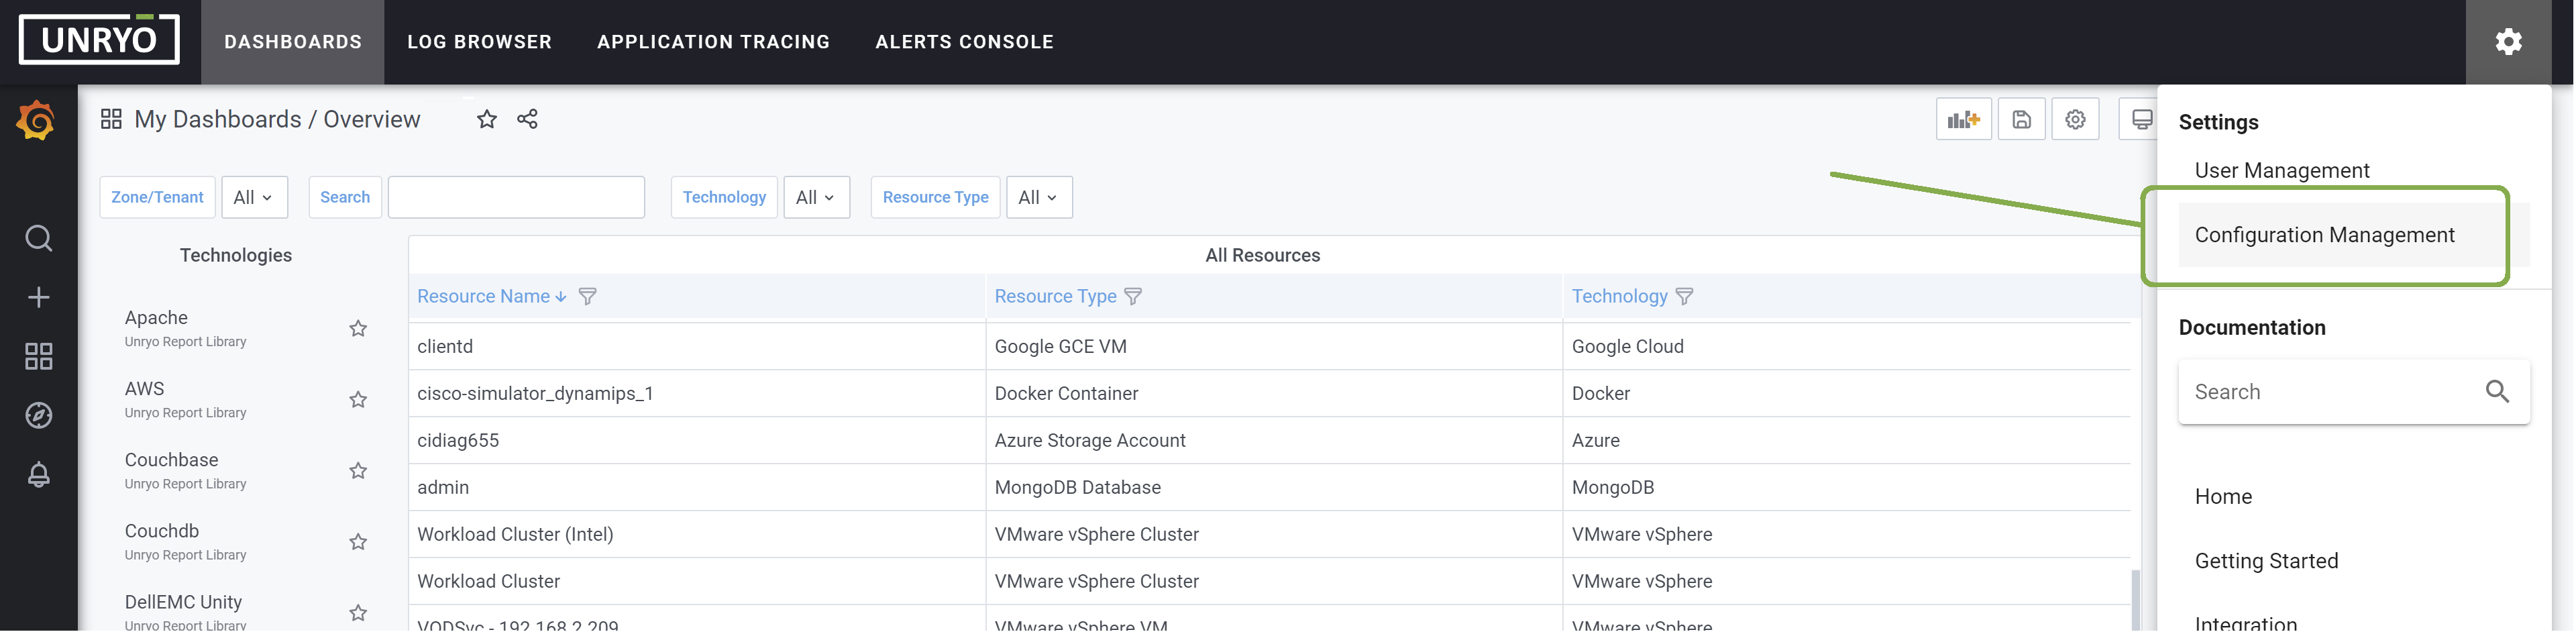
Go in Configuration Management.
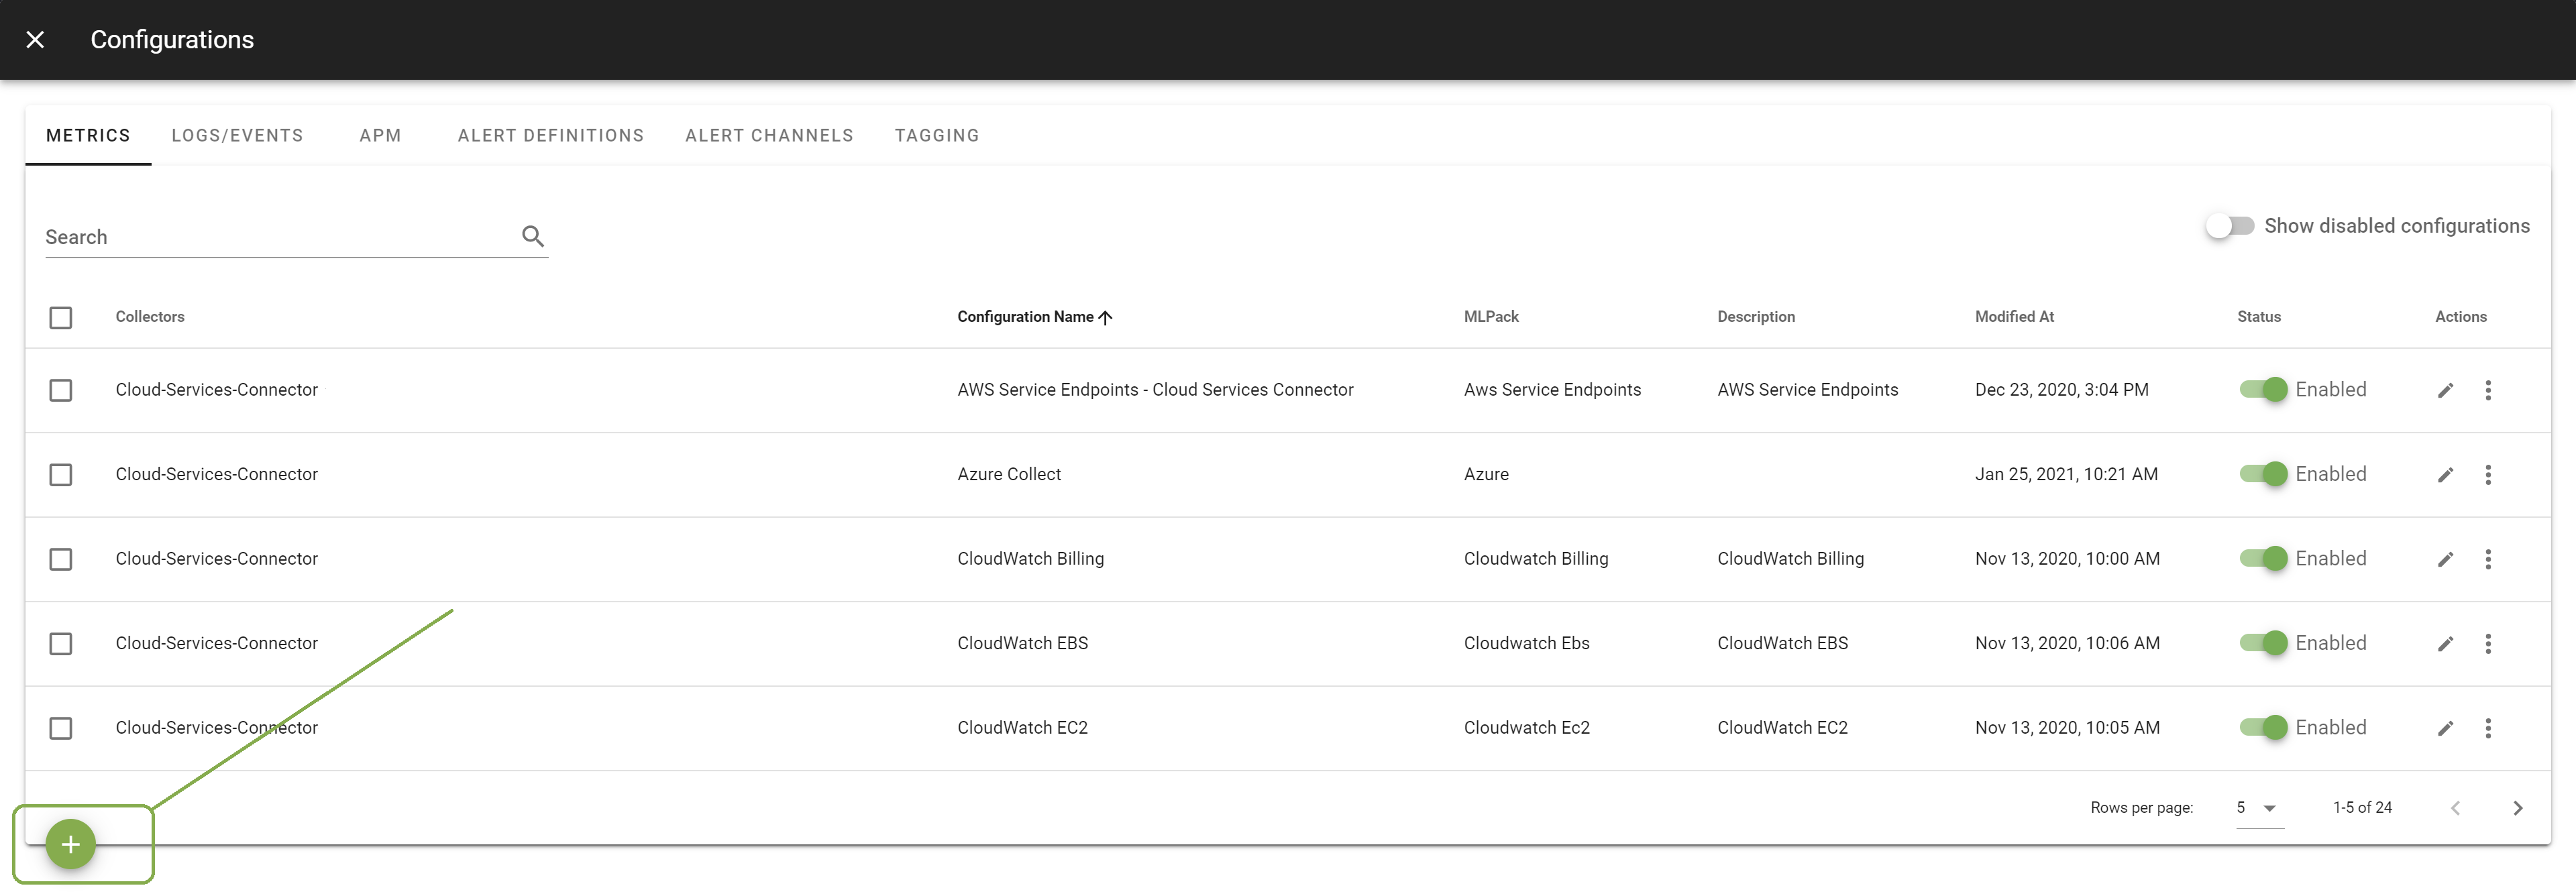
Click on the + button to add a new configuration.
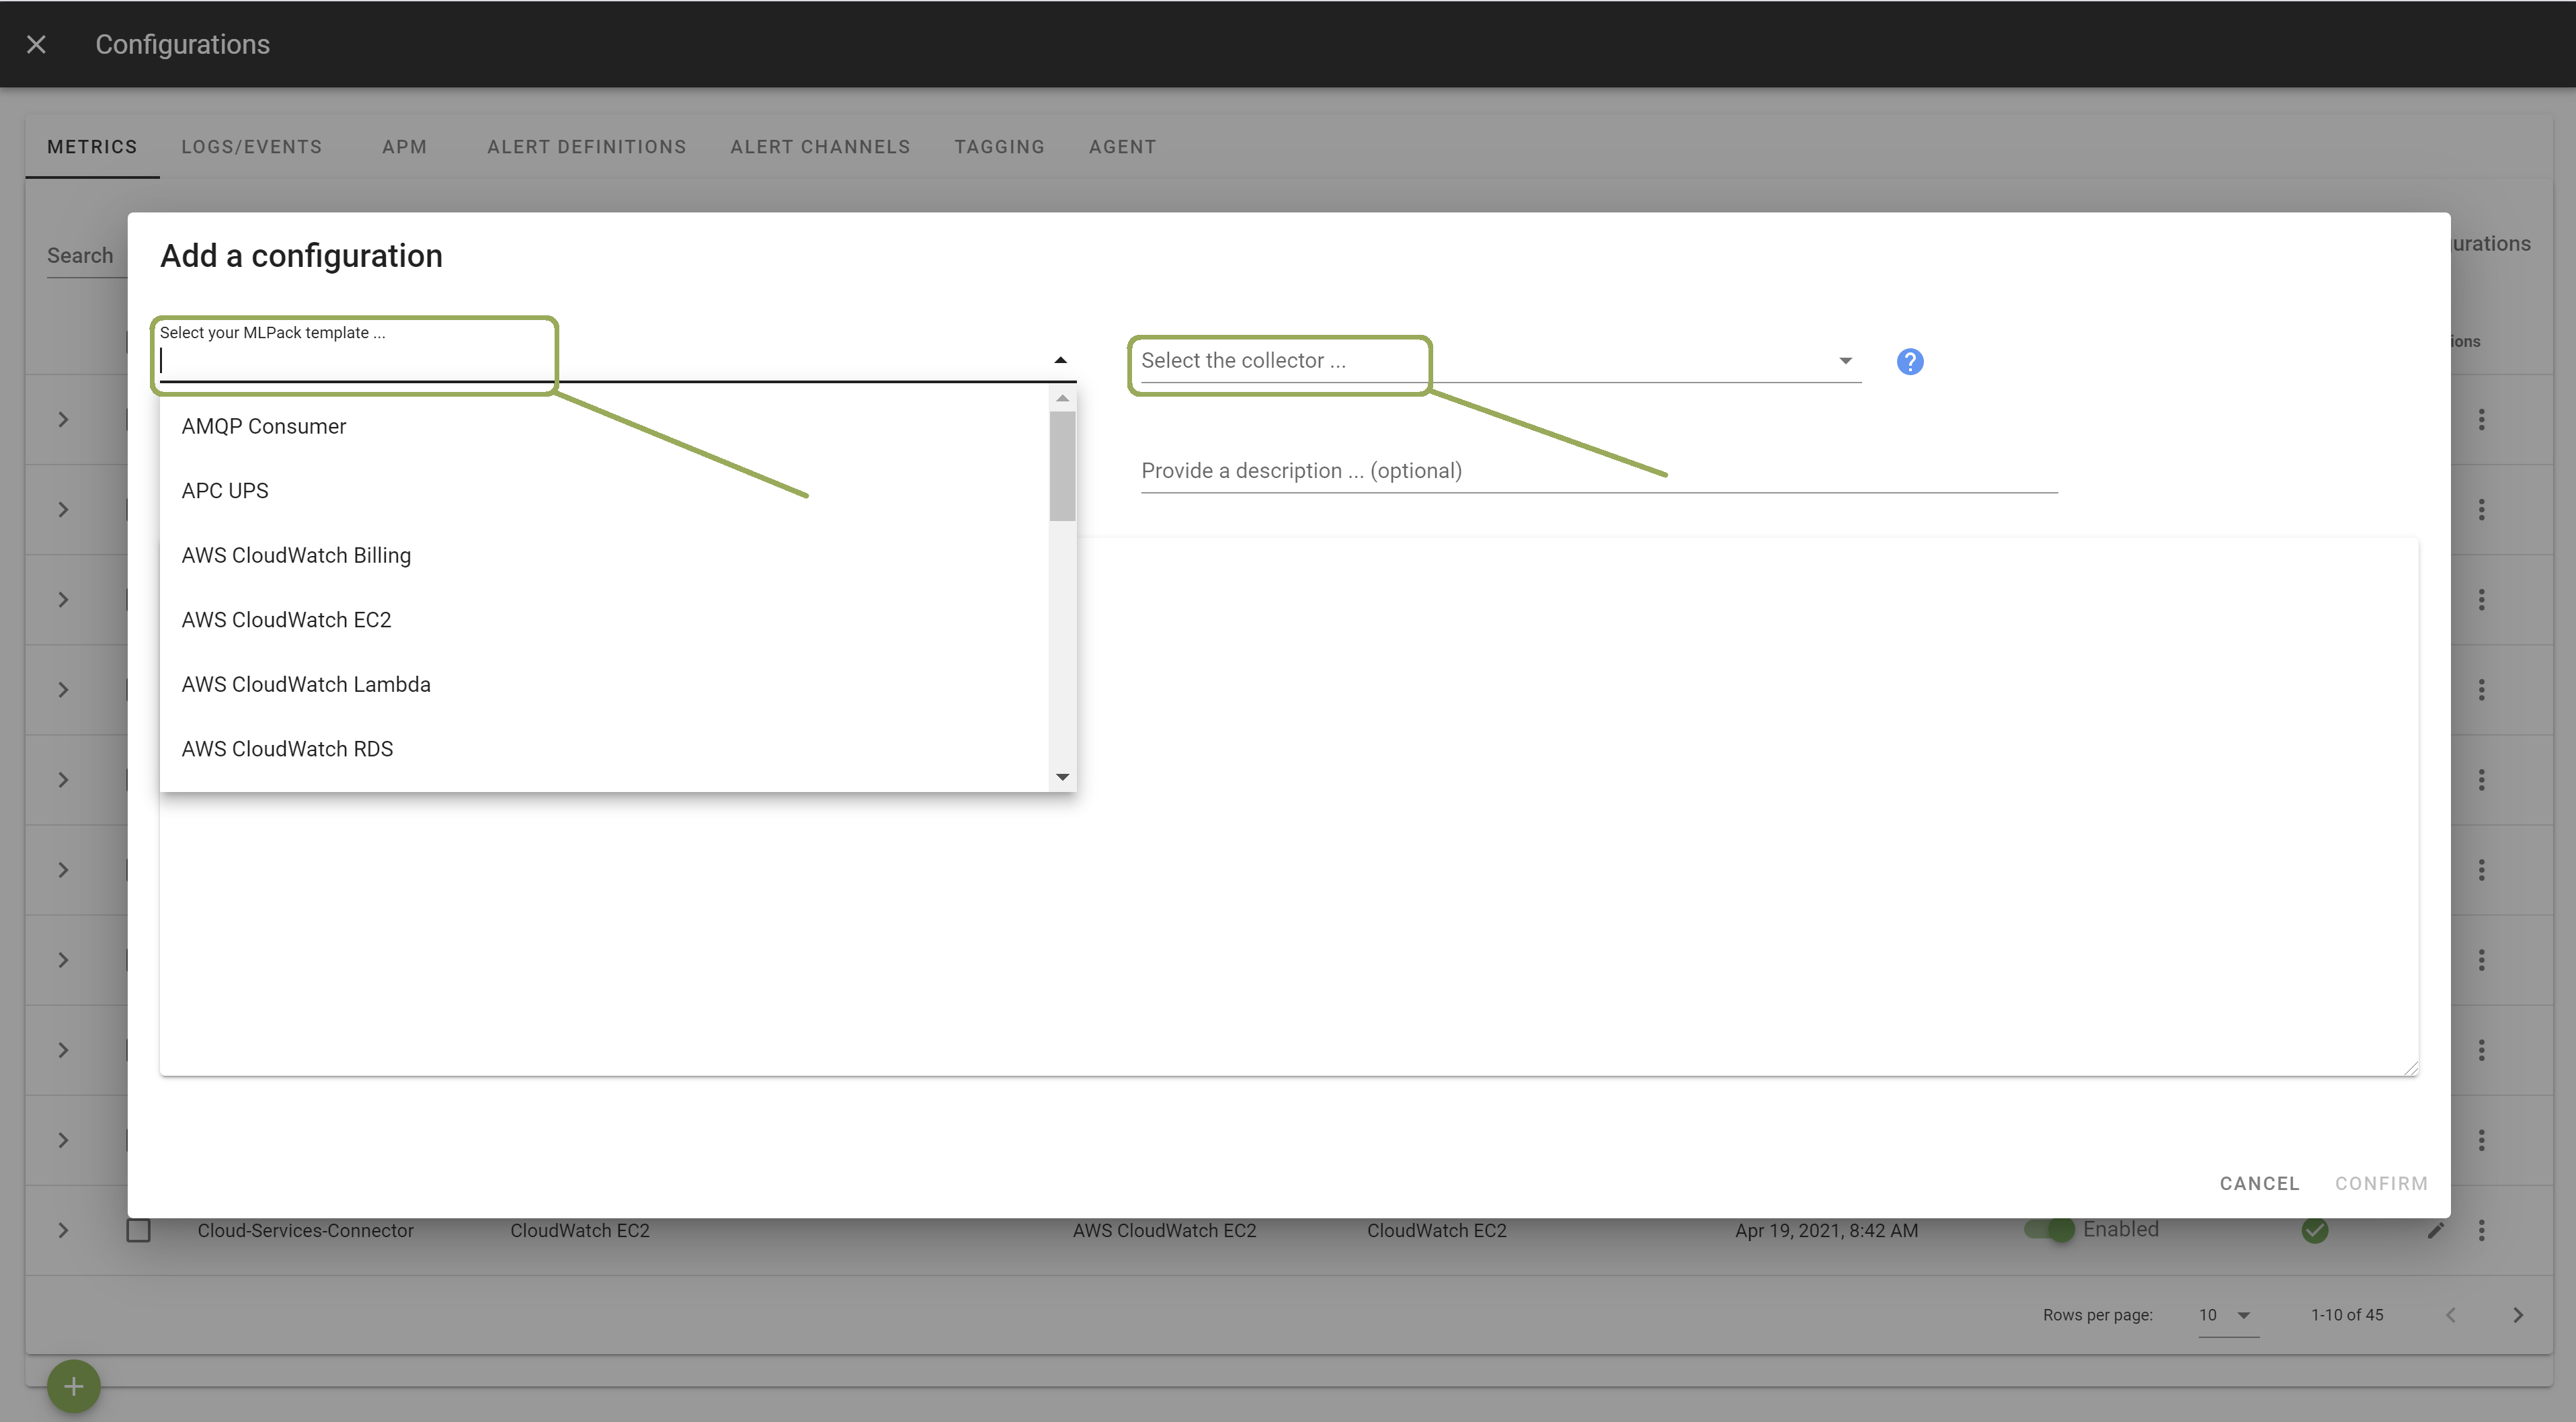
Select the template Vsphere. Select the Collector on which you want this configuration to be deployed; and provide a Configuration Name that is meaningful for you. The Description is optional.
In the template, enter the correct settings for your Vsphere server(s):
- specify the
urlandcredentialsfor your vcenter server. - the user must have full read-only access on your vcenter.
Other configuration options are possible. Browse the template to discover them.
Once done, click Apply to start the monitoring.
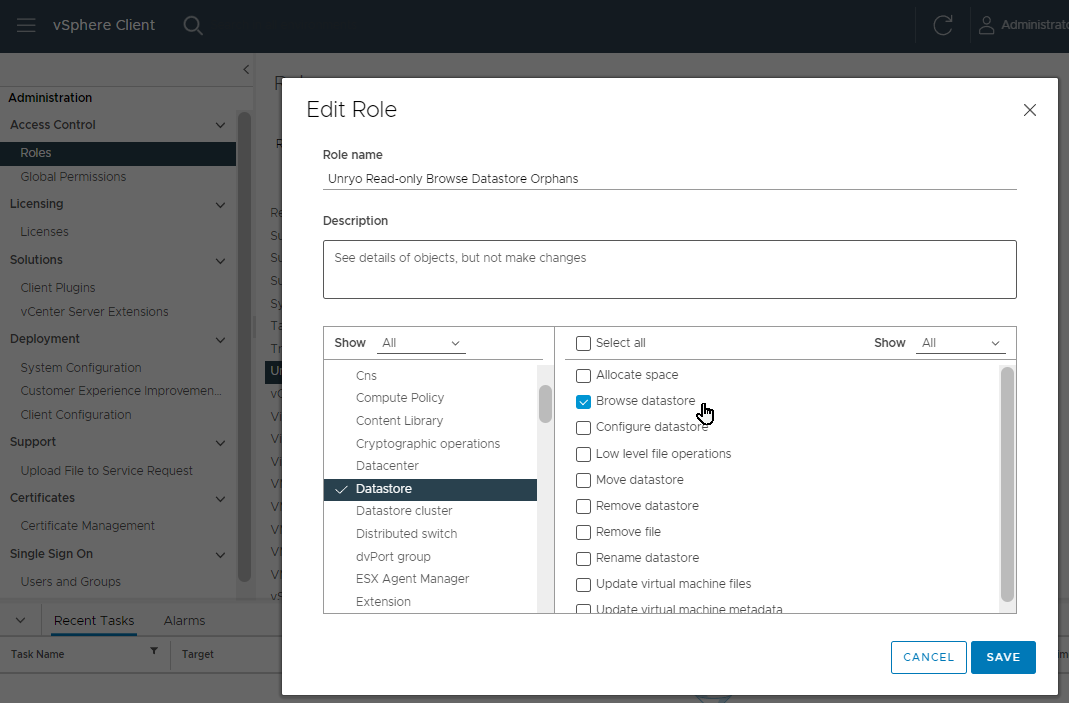
Permission for datastore/orphans monitoring#
To enable the monitoring of orphan, an extra permission for the Unryo user is required on each datastore.
To enable this permission:
-
Step 1: Under Administration/Roles, create a new role adding only the permission to browse datastore:
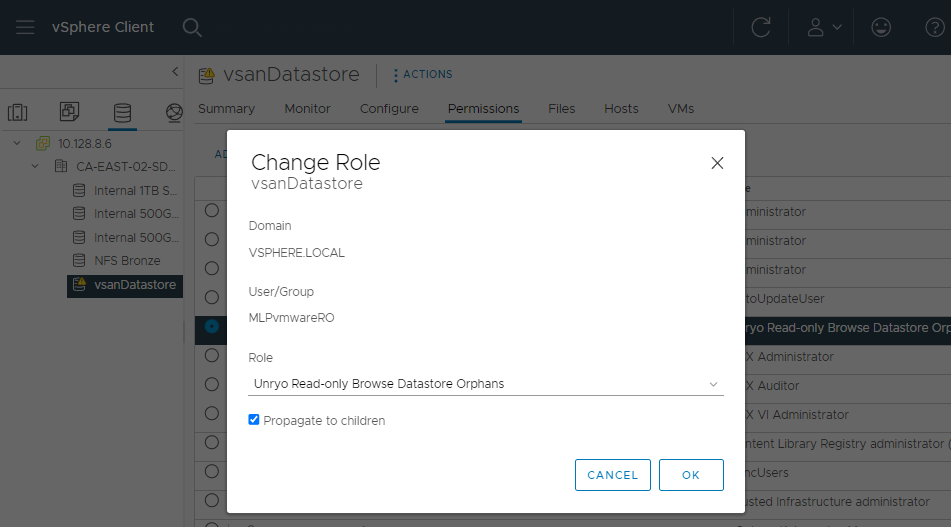
-
Step 2: For each datastore where you want to enable orphan detection, you need to add this permission/role to your Unryo user:
Metrics#
| Categories | Metrics |
|---|---|
| Virtual Machines Metrics | sys uptime,cpu costop, cpu ready, cpu run, cpu used, cpu usage, cpu usagemhz, mem usage, mem active, mem consumed, mem granted, mem swapinRate, mem swapoutRate, datastore read, datastore write, virtualDisk readLatencyUS, virtualDisk writeLatencyUS, virtualDisk numberReadAveraged, virtualDisk numberWriteAveraged, virtualDisk totalReadLatency, virtualDisk totalWriteLatency, virtualDisk readOIO, virtualDisk writeOIO, virtualDisk read, virtualDisk write, net bytesRx, net bytesTx, net droppedRx, net droppedTx |
| Hypervisor Metrics | sys uptime, cpu totalCapacity, cpu usagemhz, cpu run, cpu ready, cpu latency, cpu coreUtilization, cpu used, cpu usage, cpu utilization, cpu wait, cpu idle, cpu readiness, cpu costop, cpu swapwait, mem totalCapacity, mem granted, mem shared, mem usage, mem active, mem compressed, mem consumed, mem swapinRate, mem swapused, mem state, mem latency, mem vmmemctl, mem swapoutRate, datastore read, datastore write, disk read, disk write, disk numberReadAveraged, disk numberWriteAveraged, disk deviceReadLatency, disk deviceWriteLatency, disk totalReadLatency, disk totalWriteLatency, disk kernelReadLatency, kernelWriteLatency, storageAdapter read, storageAdapter write, storageAdapter numberReadAveraged, storageAdapter numberWriteAveraged, net errorsRx, net errorsTx, net bytesRx, net bytesTx |
| Datastore Metrics | disk used, disk capacity, disk provisioned, datastore numberReadAveraged, datastore numberWriteAveraged |