Prometheus
Prometheus#
Overview#
The ML Pack for Prometheus gathers metrics from HTTP servers exposing metrics in Prometheus format.
Note:
This data collection is generic and retrieves all metrics exposed, which can generate a high cardinality on the database. If you want more flexibility, we recommend querying the Prometheus Server using the Prometheus query language (PromQL).
Configuration#
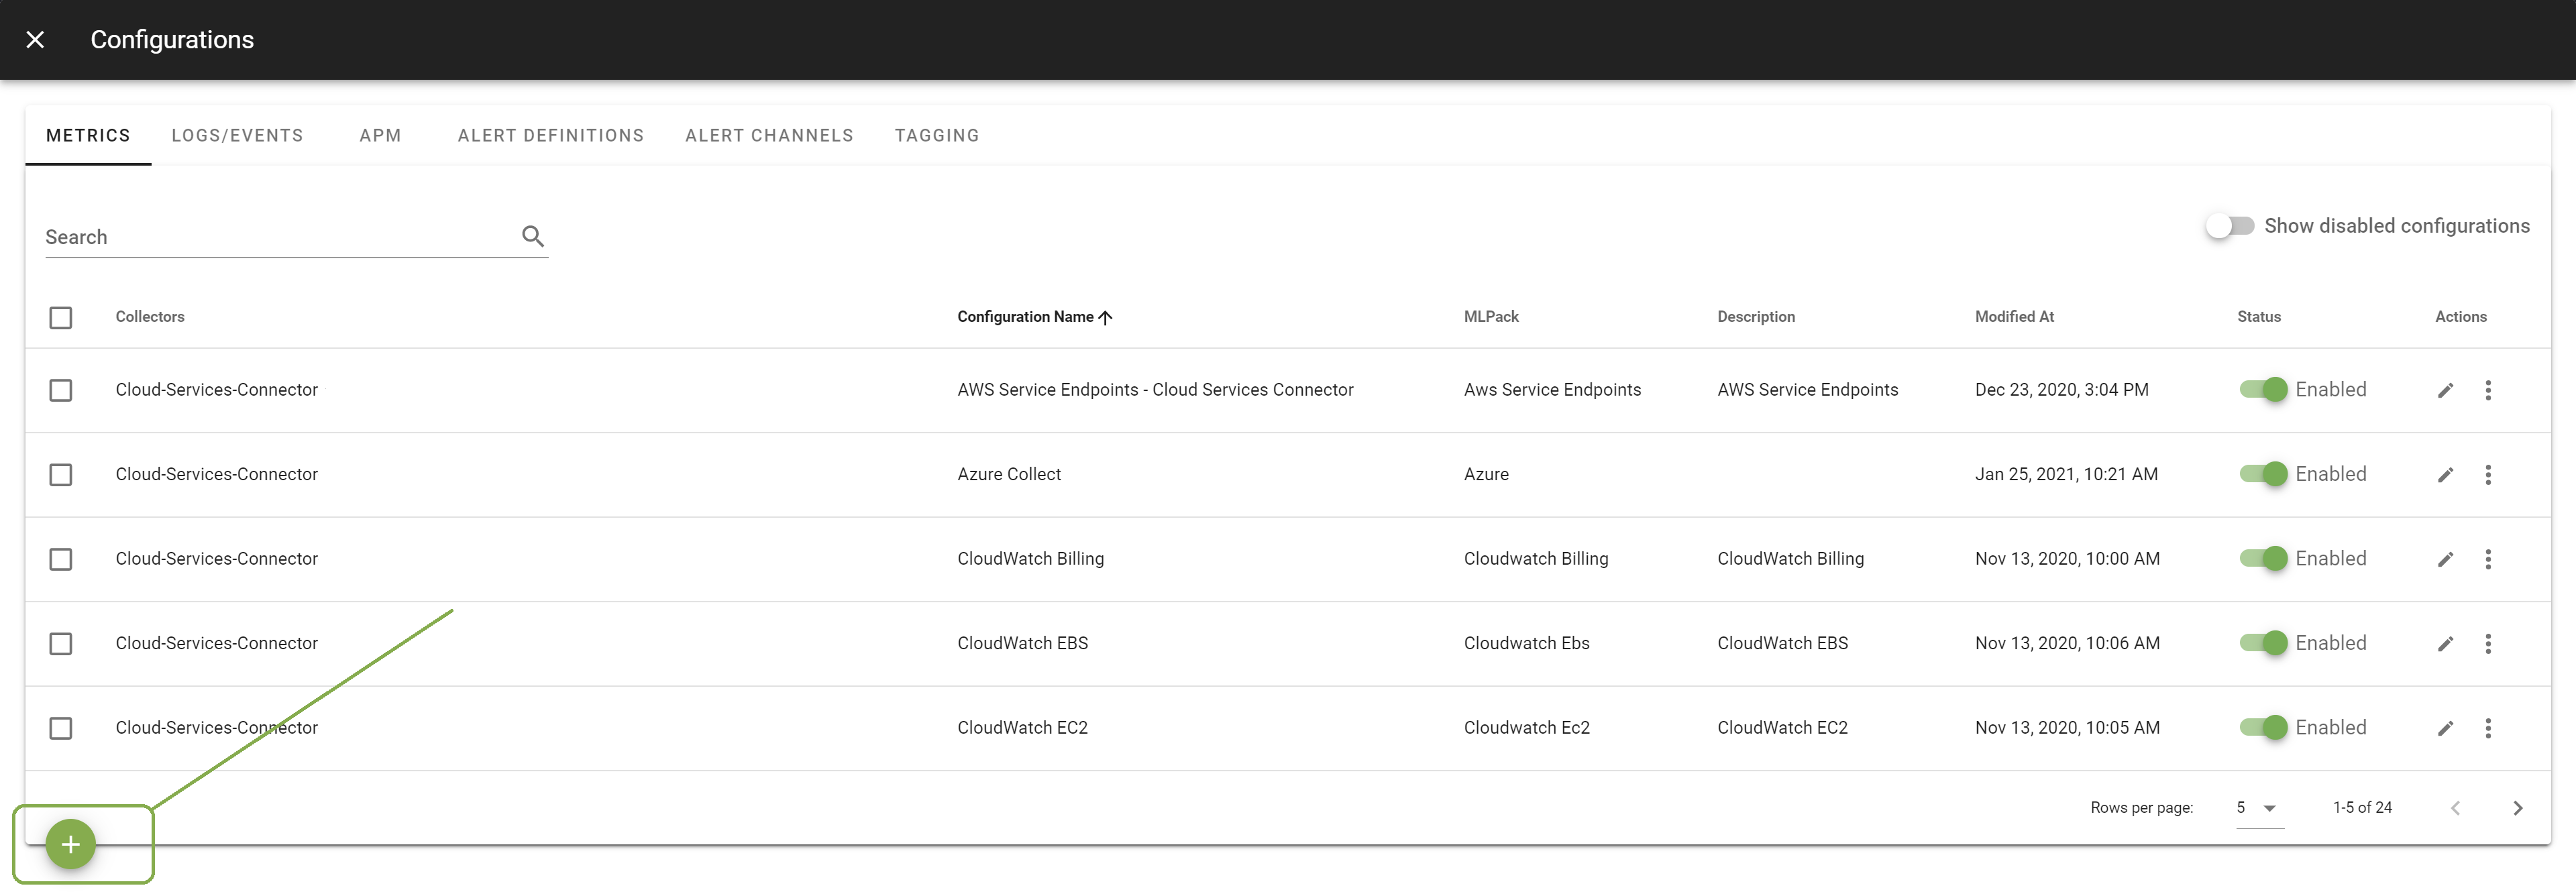
Go in Configuration Management.

Click on the + button to add a new configuration.

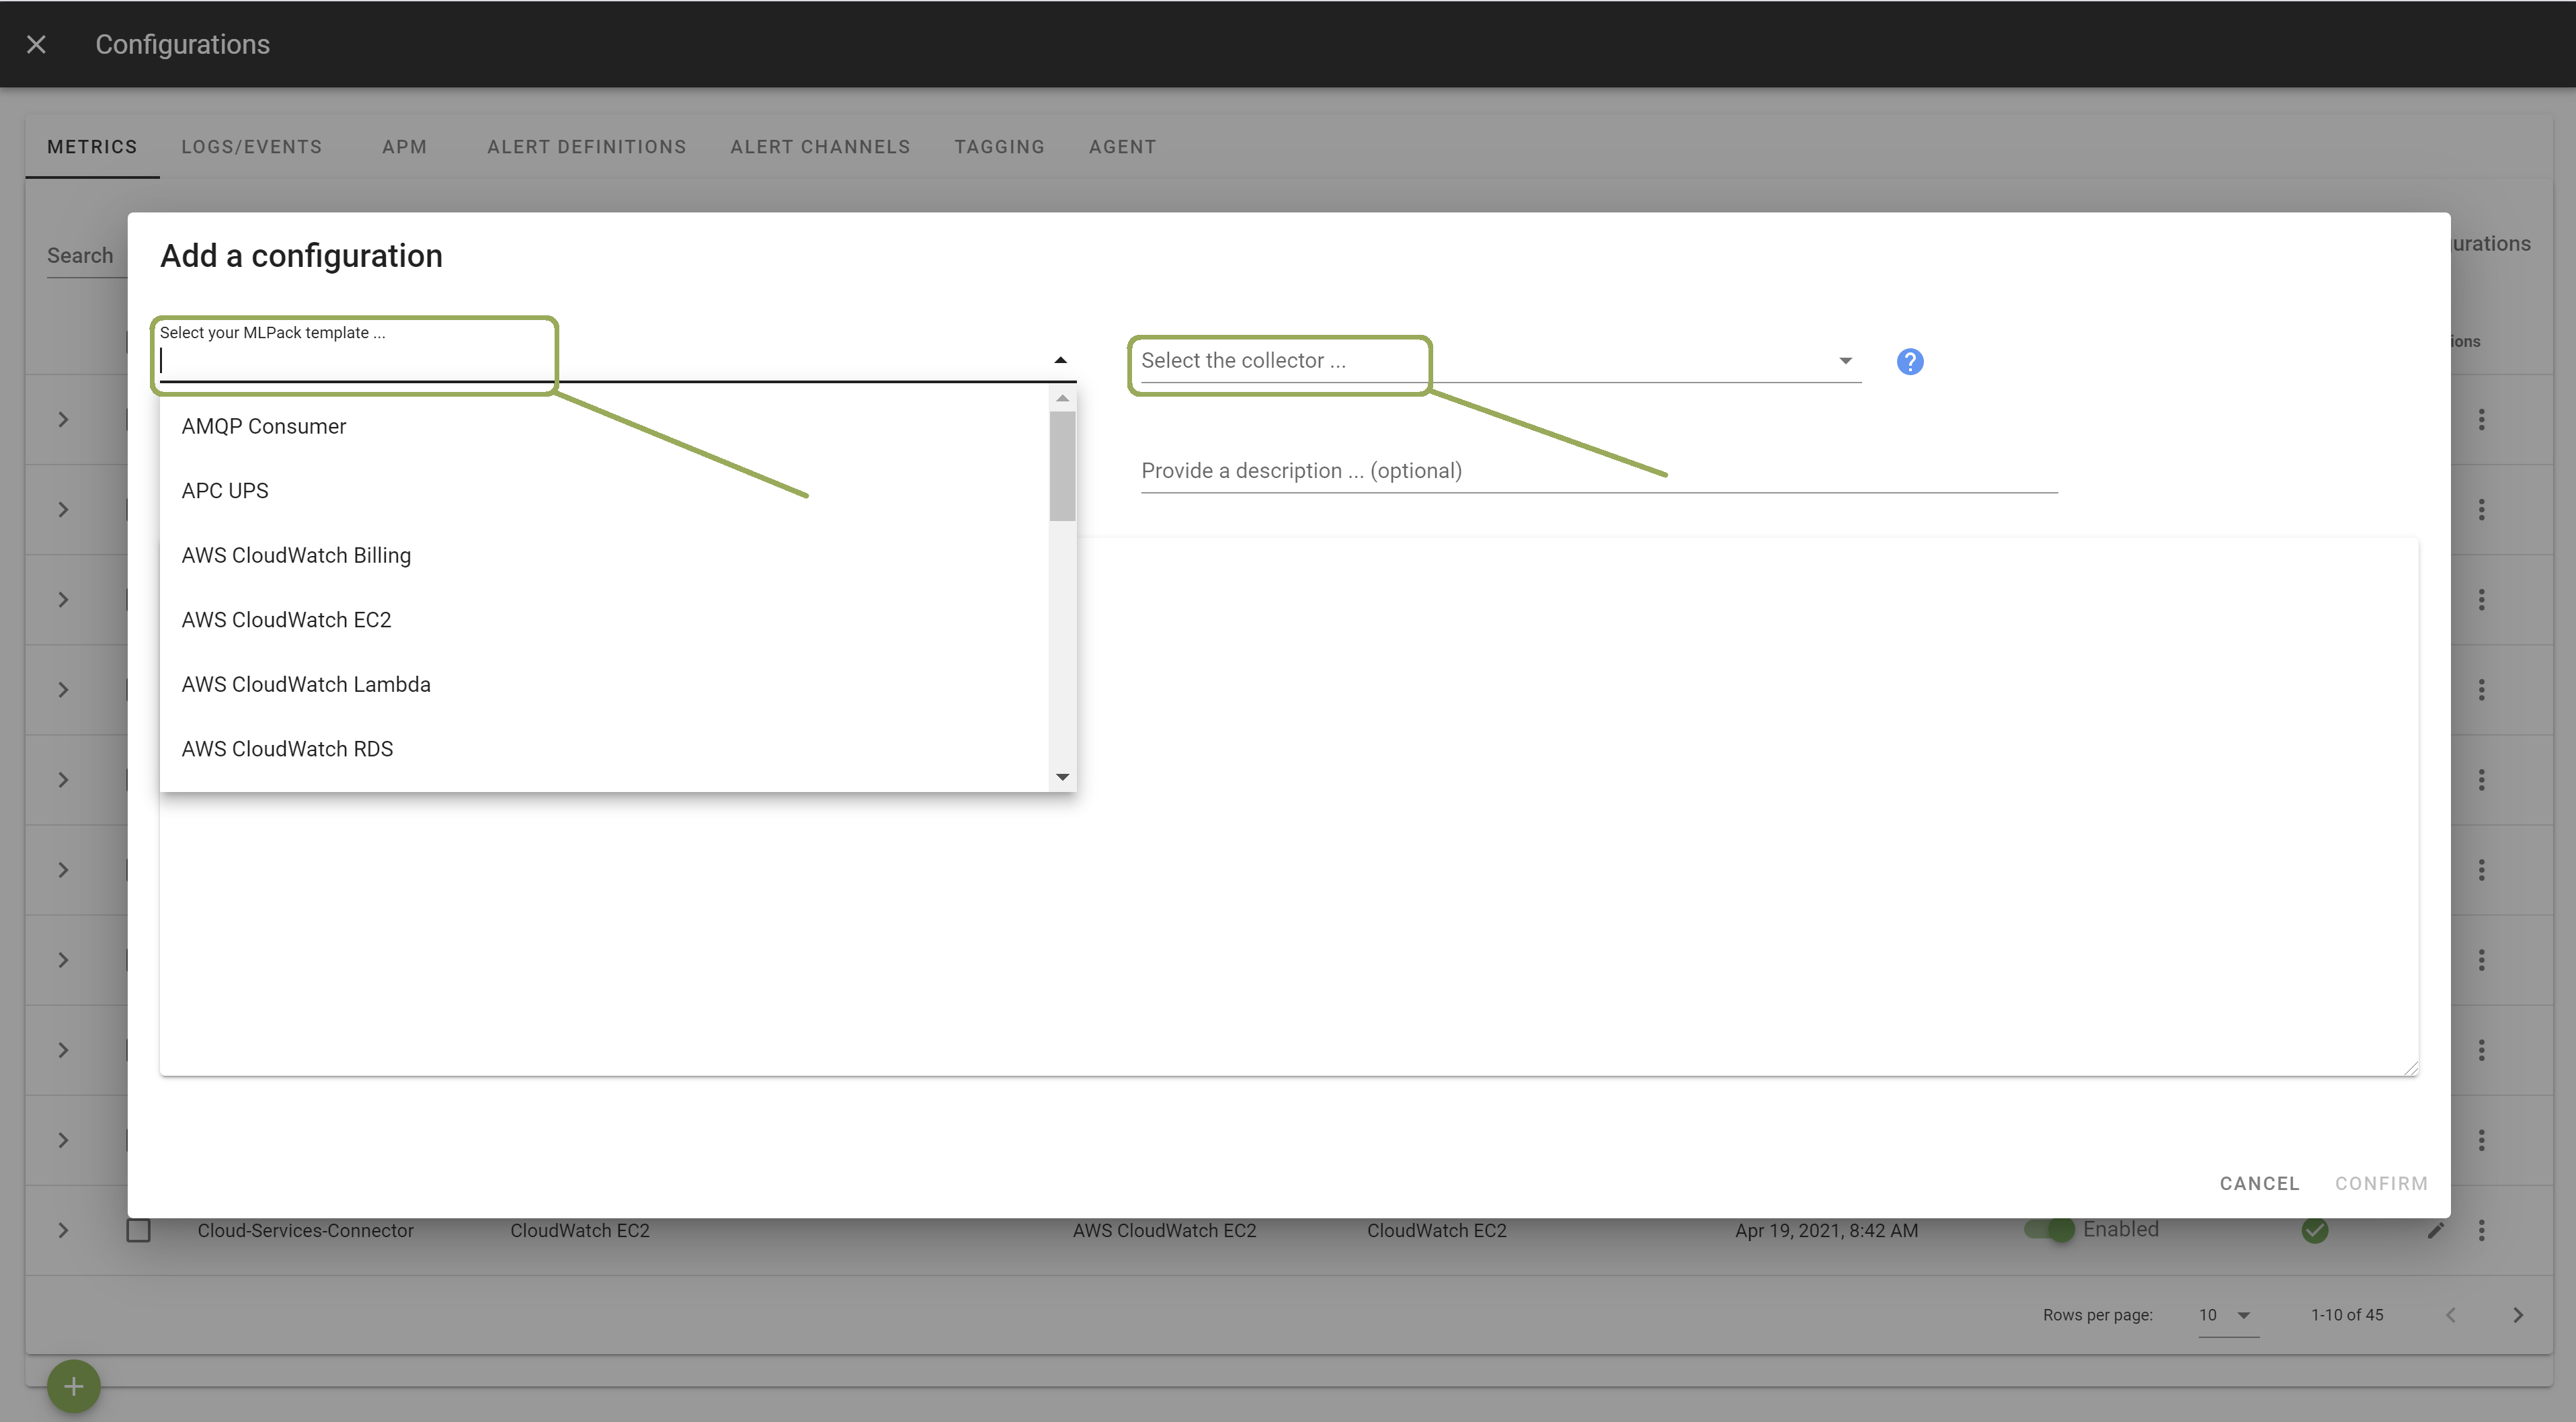
Select the template Prometheus. Select the Collector on which you want this configuration to be deployed; and provide a Configuration Name that is meaningful for you. The Description is optional.

In the template, list the urls to gather metrics from. Other configuration options are possible. Browse the template to discover them.
Once done, click Apply to start the monitoring.