Process Monitoring
Process Monitoring#
Overview#
Unryo provides process availability and performance monitoring for hosts that support SNMP and for hosts that run a local Unryo agent. In particular, you can monitor and be alerted when:
- a particular process is missing
- a particular process count if out of range
- a particular process is consuming high cpu or memory utilization
Configuration#
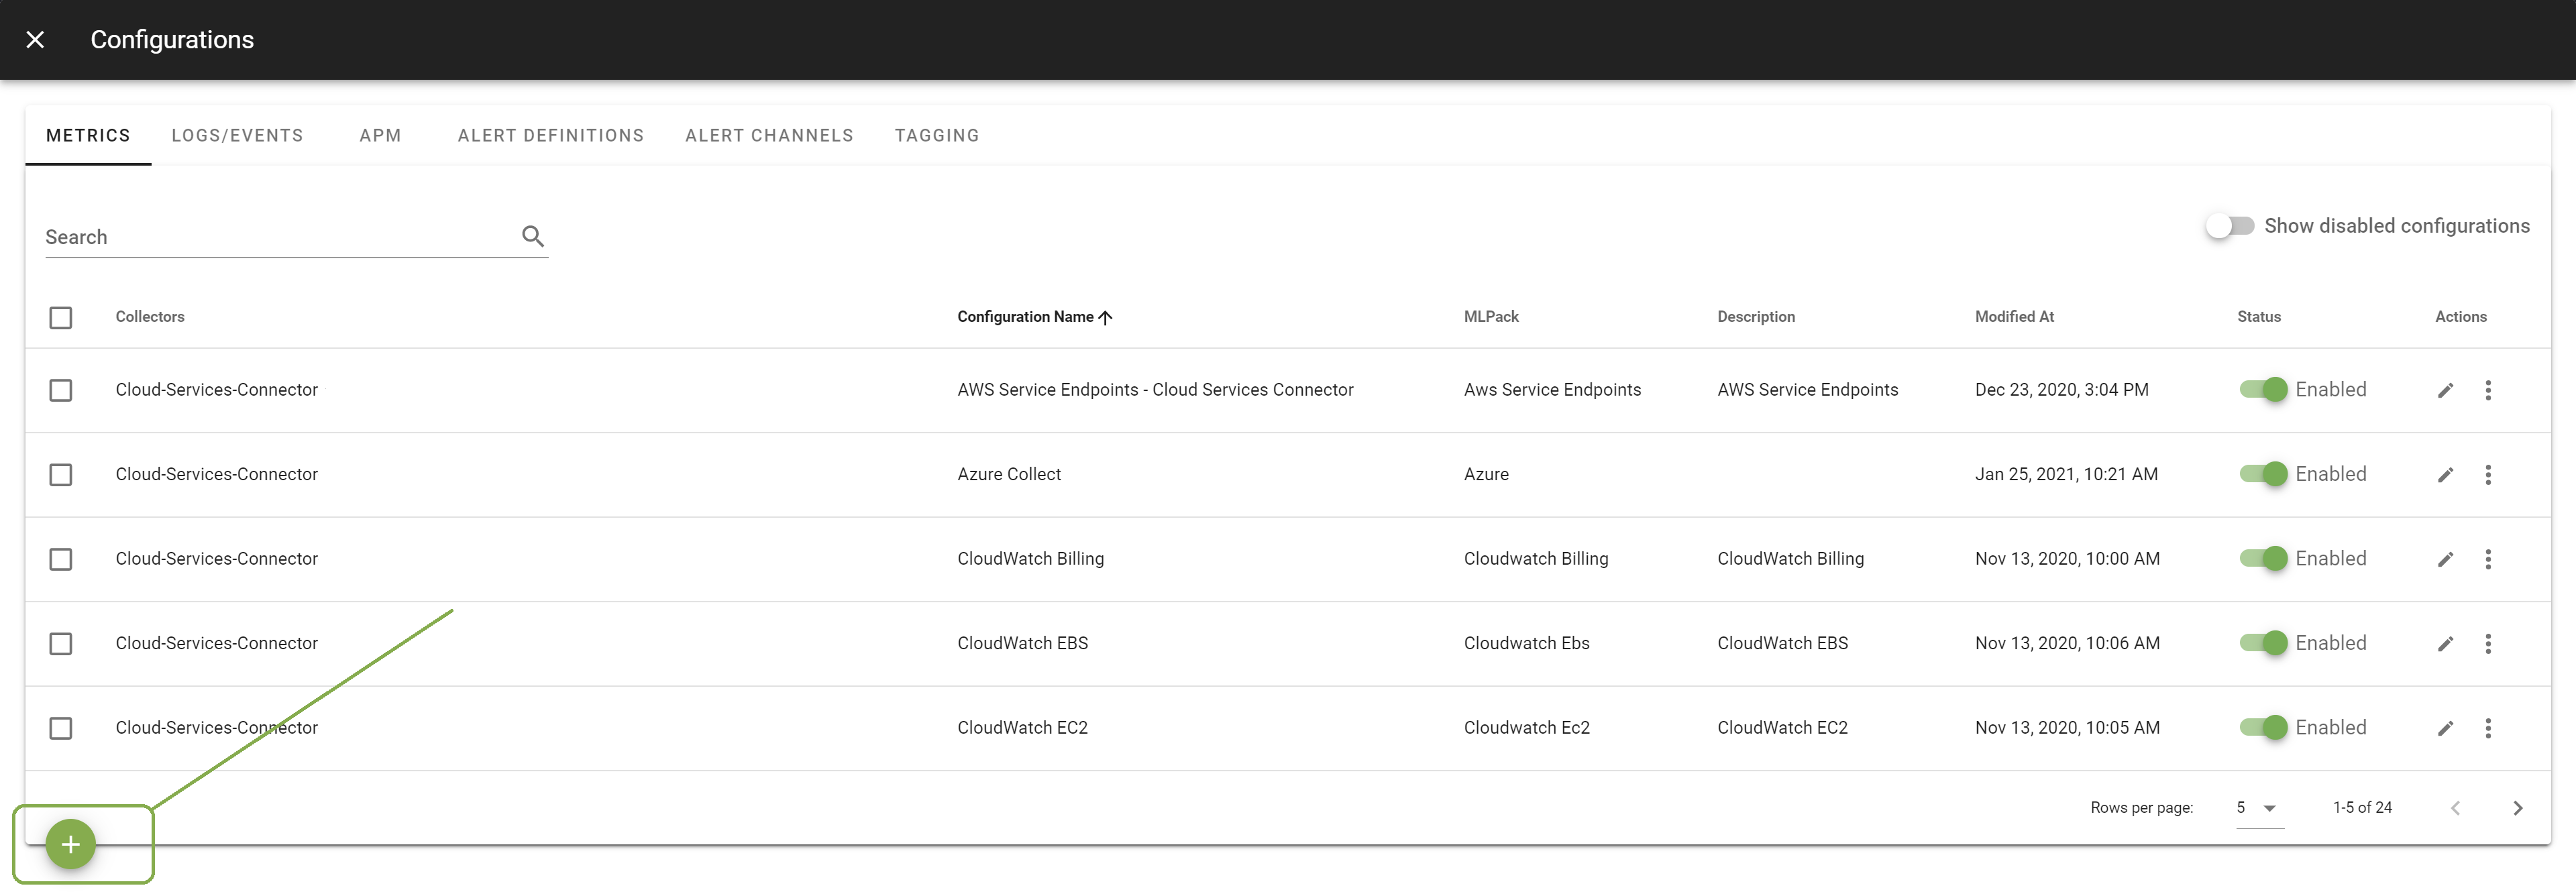
Go in Configuration Management.

Click on the + button to add a new configuration.

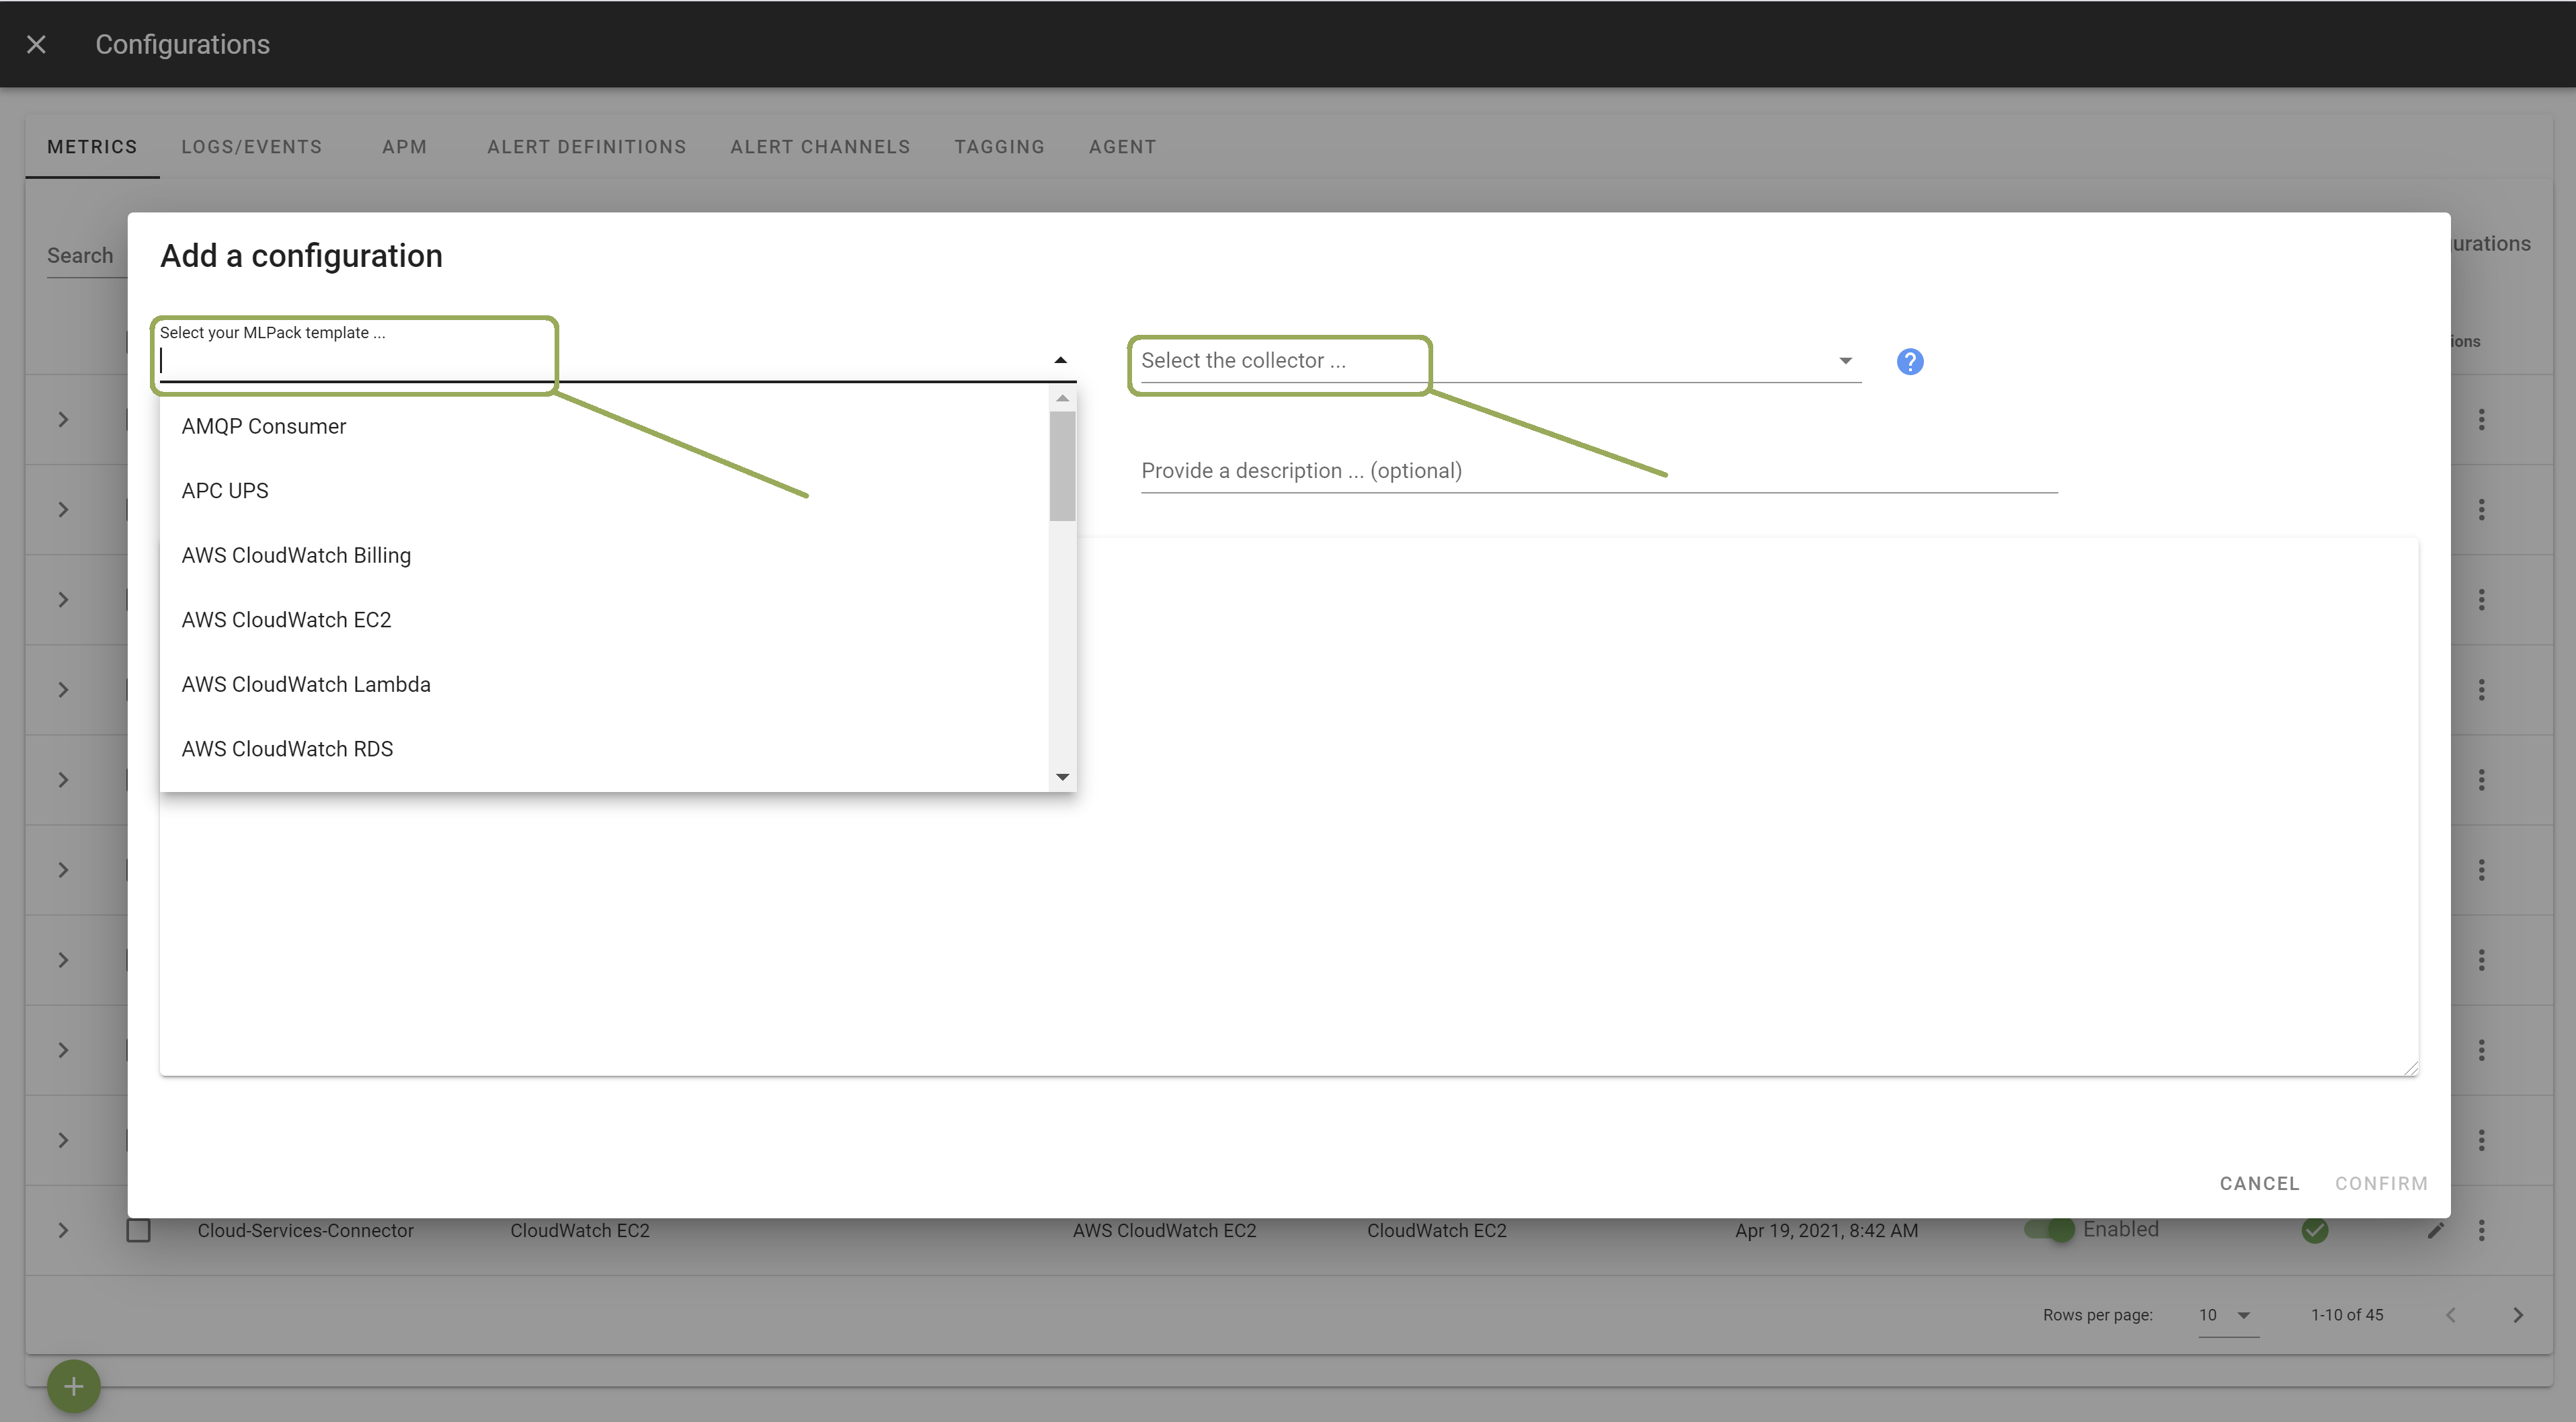
Select the template that fits your monitoring need, based on the table below. Then, select the Collector on which you want this configuration to be deployed; and provide a Configuration Name that is meaningful for you. The Description is optional.
For SNMP-enabled servers or devices:
| Use-Case | Configuration Template | Alert Template | Dashboard |
|---|---|---|---|
| Monitor presence and system usage (cpu, memory) of one or more processes | Use the template "Unryo Snmp Process Monitoring". Indicate the process name and args (both process names and arguments are matched exactly.) | SNMP Process Down | CI Details / Process Monitoring |
| Monitor if the count of a process is out of range | Use the template "SNMP Process Count". | SNMP Process Count | CI Details / Process Monitoring (Count) |
For Linux or Windows servers with a local Unryo agent:
| Use-Case | Configuration Template | Alert Template | Dashboard |
|---|---|---|---|
| Monitor presence and system usage (cpu, memory) of one or more processes for Linux Servers | Use the template Agent > "Linux Process Monitoring". | Process Down - Linux | CI Details / Process Monitoring (Agent) |
| Monitor presence and system usage (cpu, memory) of one or more processes for Windows Servers | Use the template Agent > "Windows Process Monitoring". | Process Down - Windows | CI Details / Process Monitoring (Agent) |
| Monitor system usage (cpu, memory) of one or more processes for Windows Servers | use the template Agent > "Windows Process Statistics". | CI Details / Windows Server Details | |
| Monitor Windows service status | use the template Agent > "Windows Services". | CI Details / Windows Server Details |

In the template, enter the correct settings. Other configuration options are possible. Browse the template to discover them.
Once done, click Apply to start the monitoring.