Microsoft SQL Server
Microsoft SQL Server#
Overview#
The ML Pack for Microsoft SQL Server monitors the performance of your SQL Server instances (2008 SP3 and newer), through out-of-the-box dashboards on user connections, memory, resource pools, workload groups, buffer, database replica, and more.
Prerequisites#
You have to create a login on every instance you want to monitor, with following script:
USE master;
GO
CREATE LOGIN [UnryoCollector] WITH PASSWORD = N'mystrongpassword';
GO
GRANT VIEW SERVER STATE TO [UnryoCollector];
GO
GRANT VIEW ANY DEFINITION TO [UnryoCollector];
GO
Configuration#
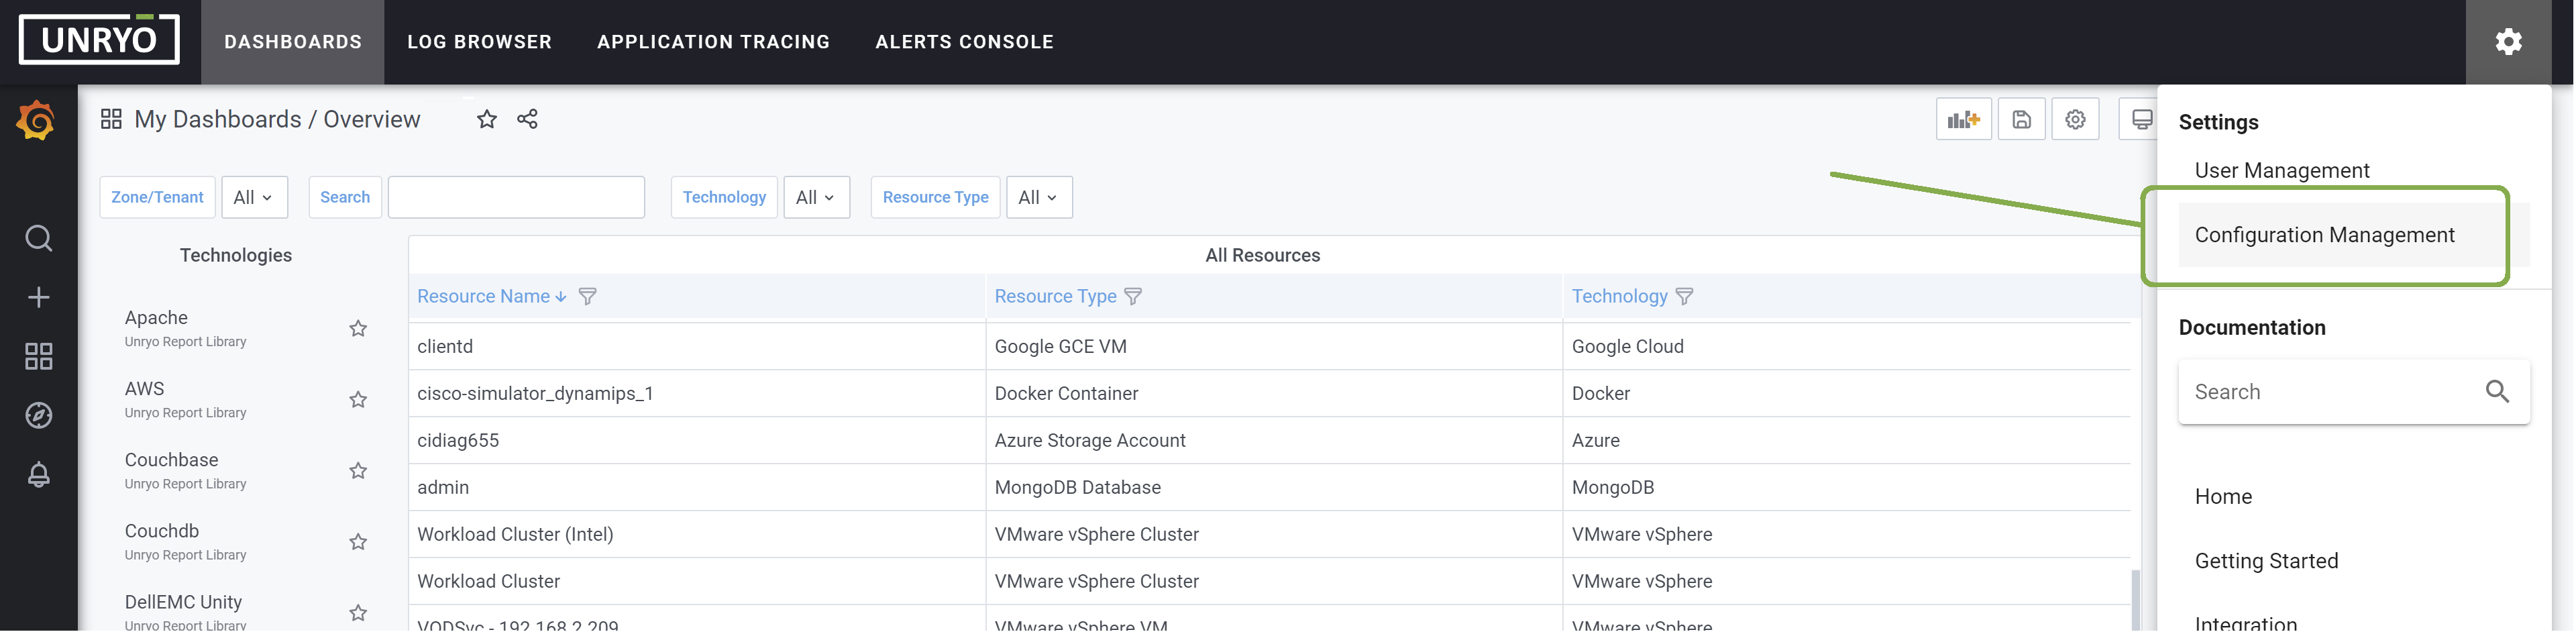
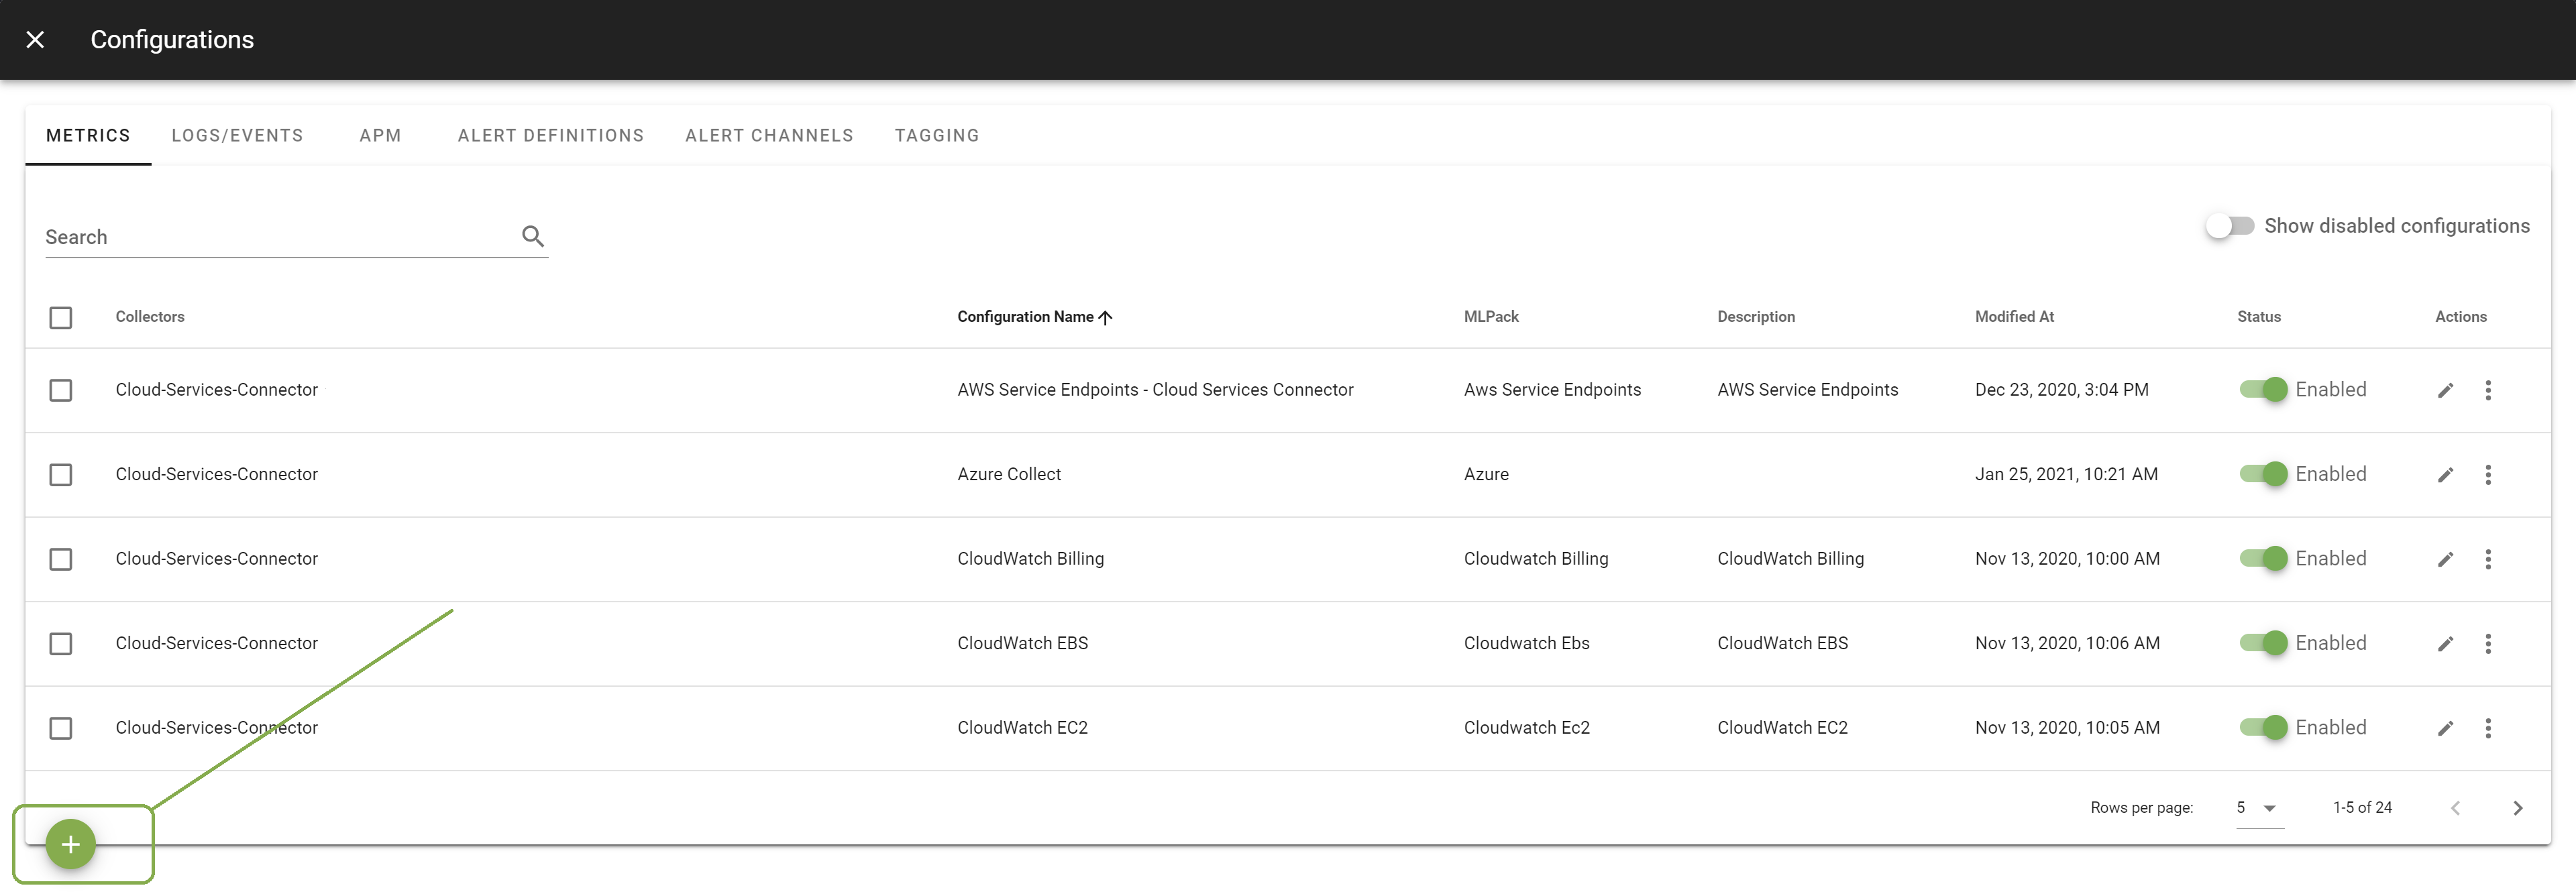
Go in Configuration Management.
Click on the + button to add a new configuration.
Select the template Sqlserver. Select the Collector on which you want this configuration to be deployed; and provide a Configuration Name that is meaningful for you. The Description is optional.
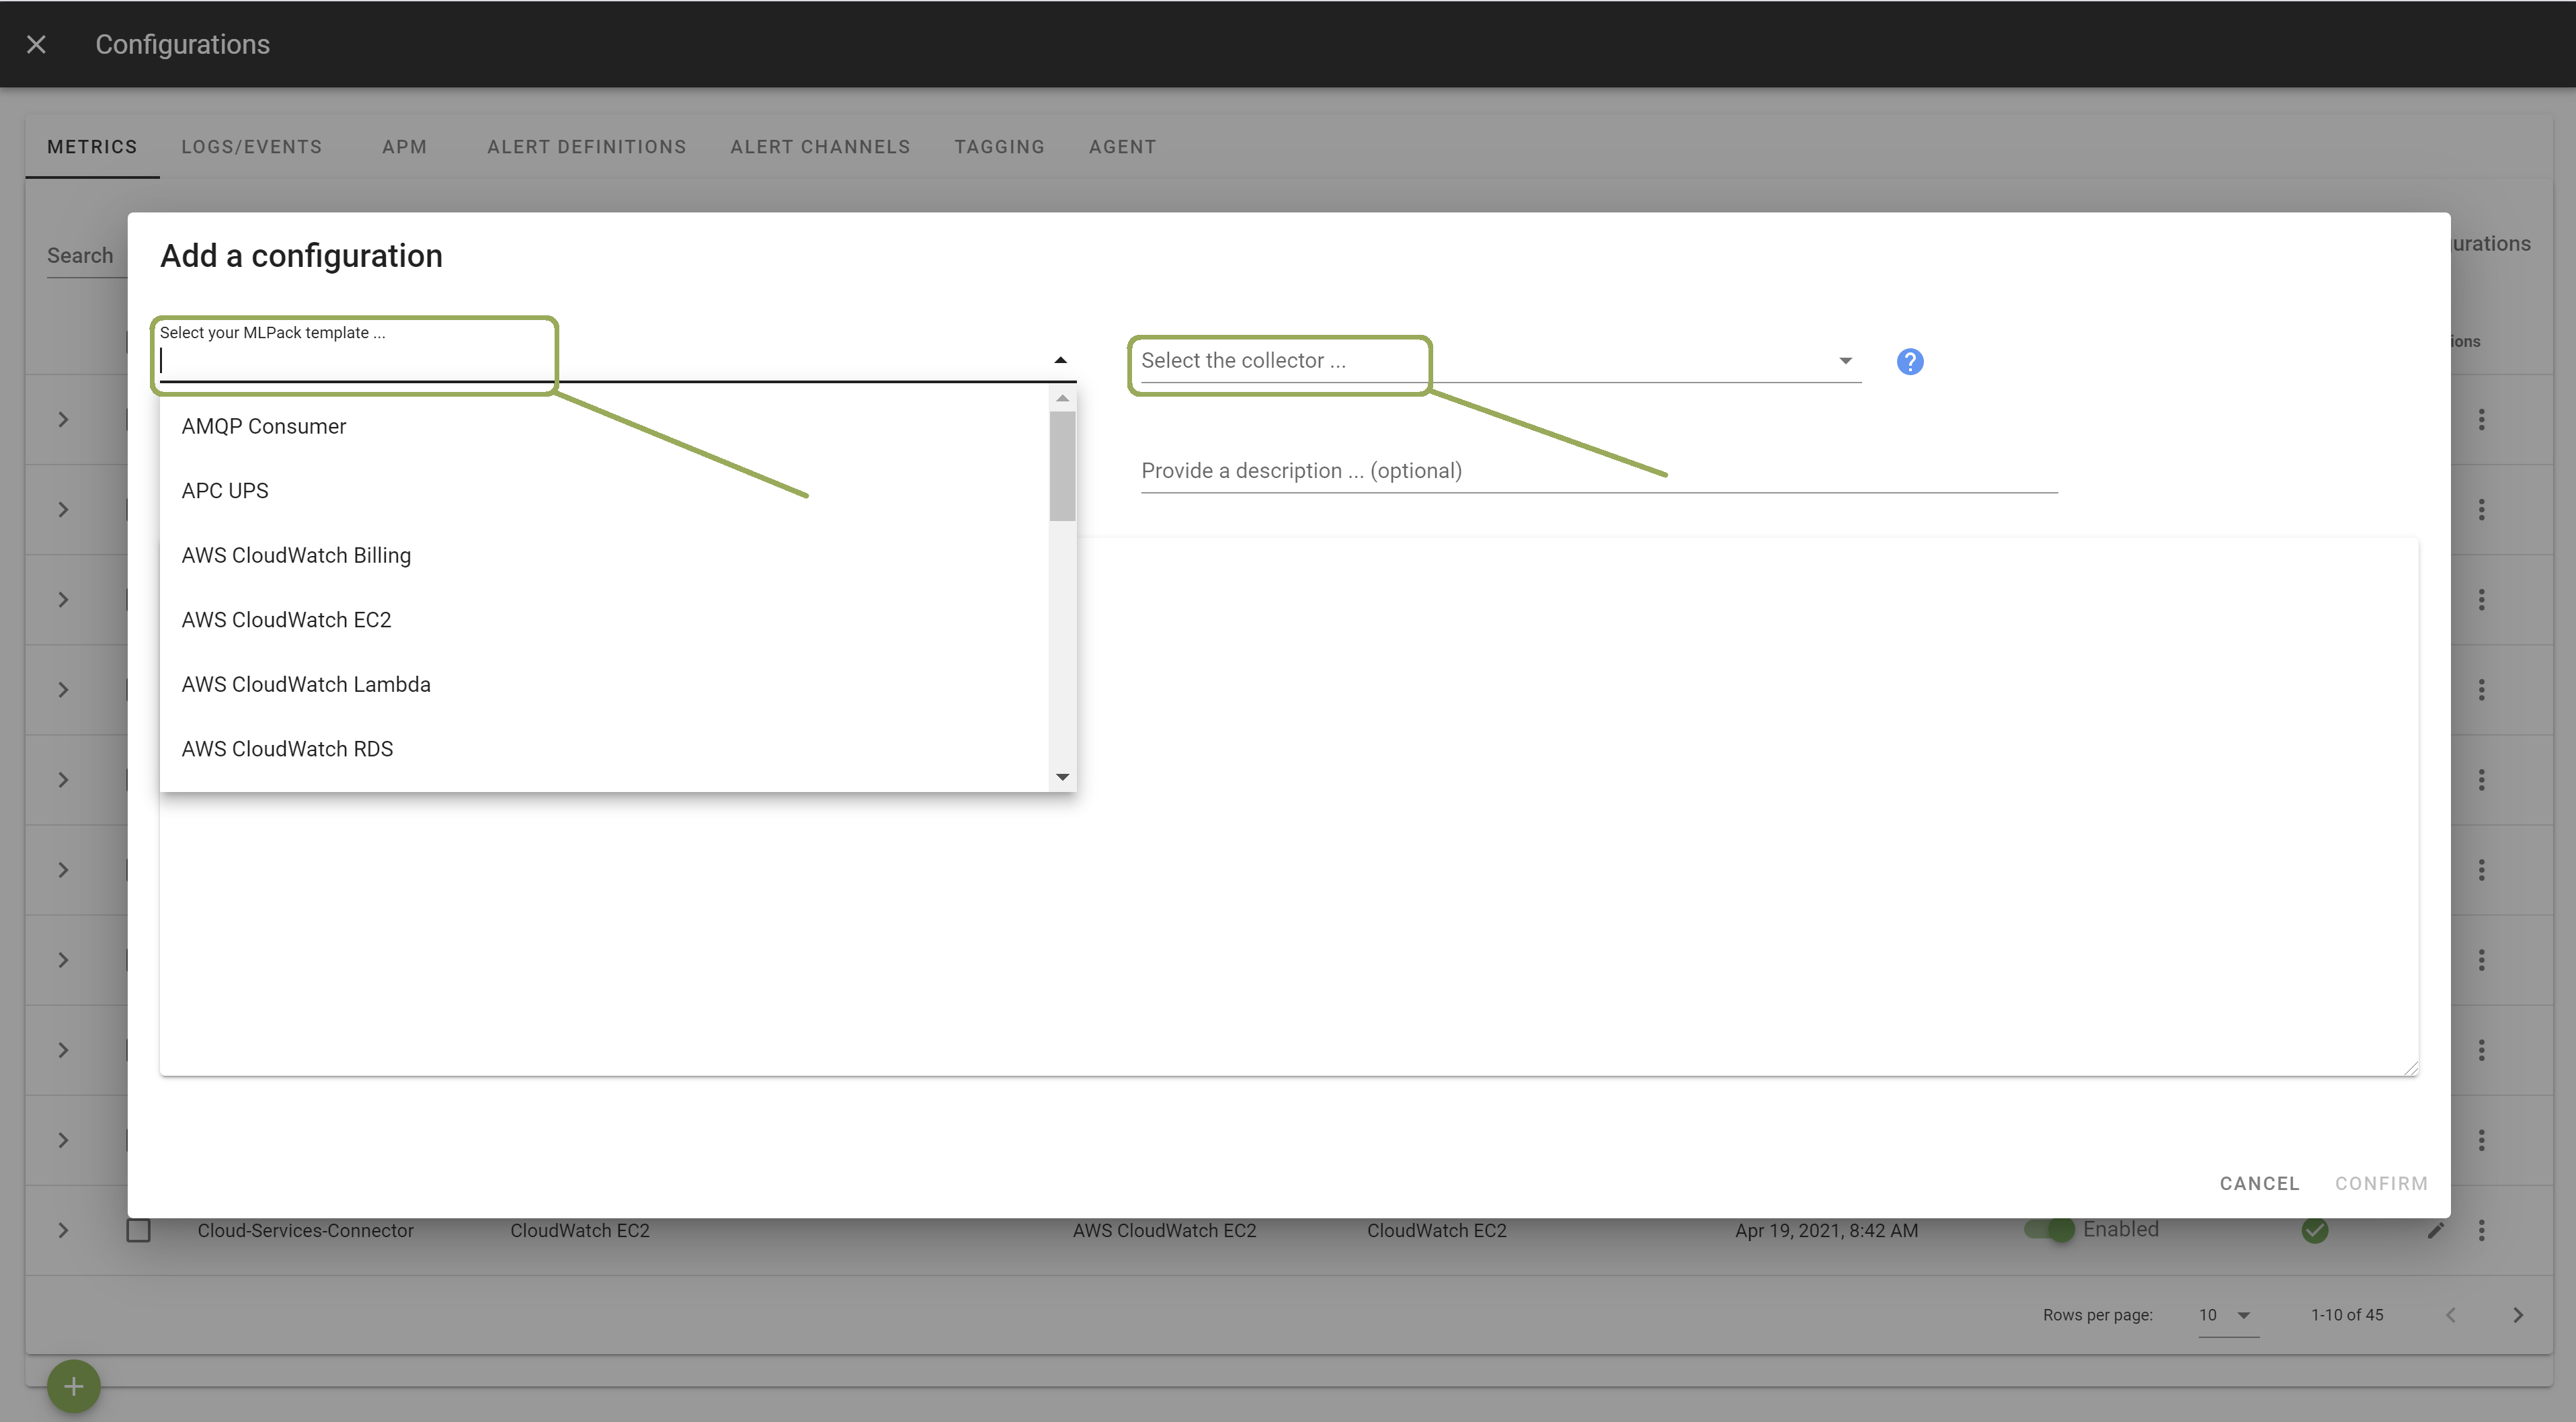
In the template, enter the correct settings for your Sqlserver server(s). Other configuration options are possible. Browse the template to discover them.
Once done, click Apply to start the monitoring.
Metrics#
| Measurements | Fields |
|---|---|
| Server | uptime, number of databases, total storage, available storage, total memory, used memory, user connections, ... |
| Transactions | writes, delay, memory, grant, pages writes/sec, buffer cache hits, index searches, ... |
| Requests | total, completed, resent, sends to replicas, ... |
| Database | Size, Queues. log, memory, grant, pages writes/sec, buffer cache hits, index searches, ... |
| Database IO | read, write, Read Latency, write Latency, wait Stats, disk write, disk read, ... |
| Memory Clerk | size of bound trees size, pool memory size, connection pool size, ... |