Mesos
Mesos#
Overview#
The ML Pack for Mesos displays real-time and over-time information on the Mesos cluster, master and slave nodes. It covers system resources, connection status, frameworks, tasks, messages, etc.
Configuration#
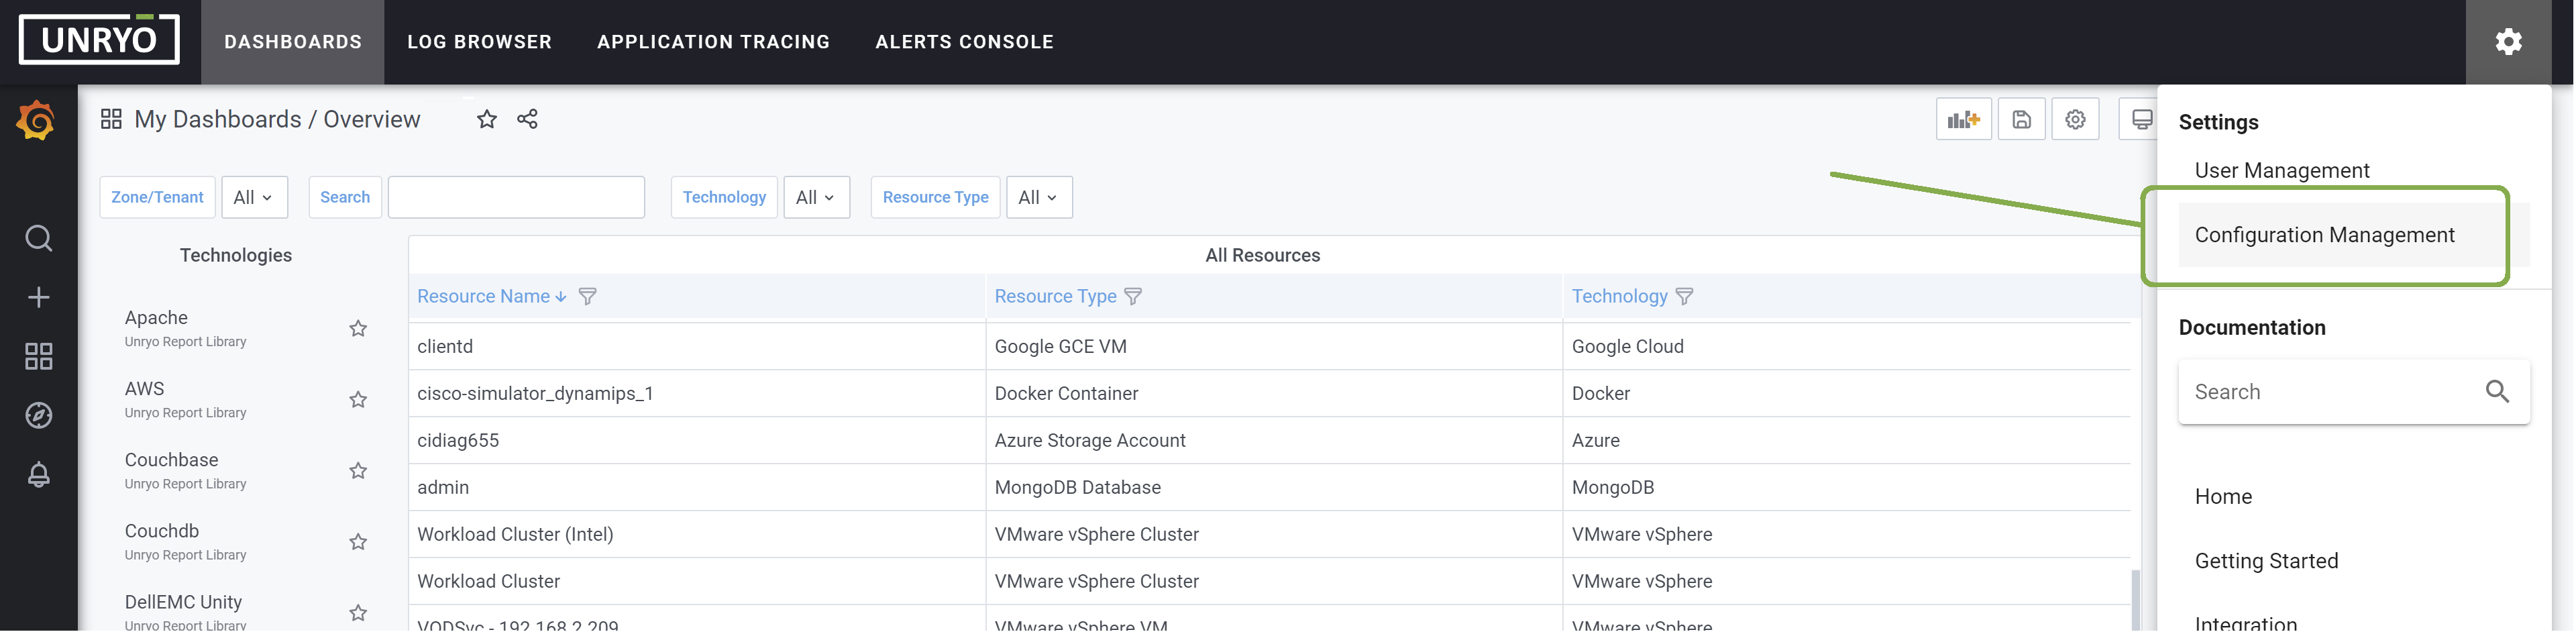
Go in Configuration Management.
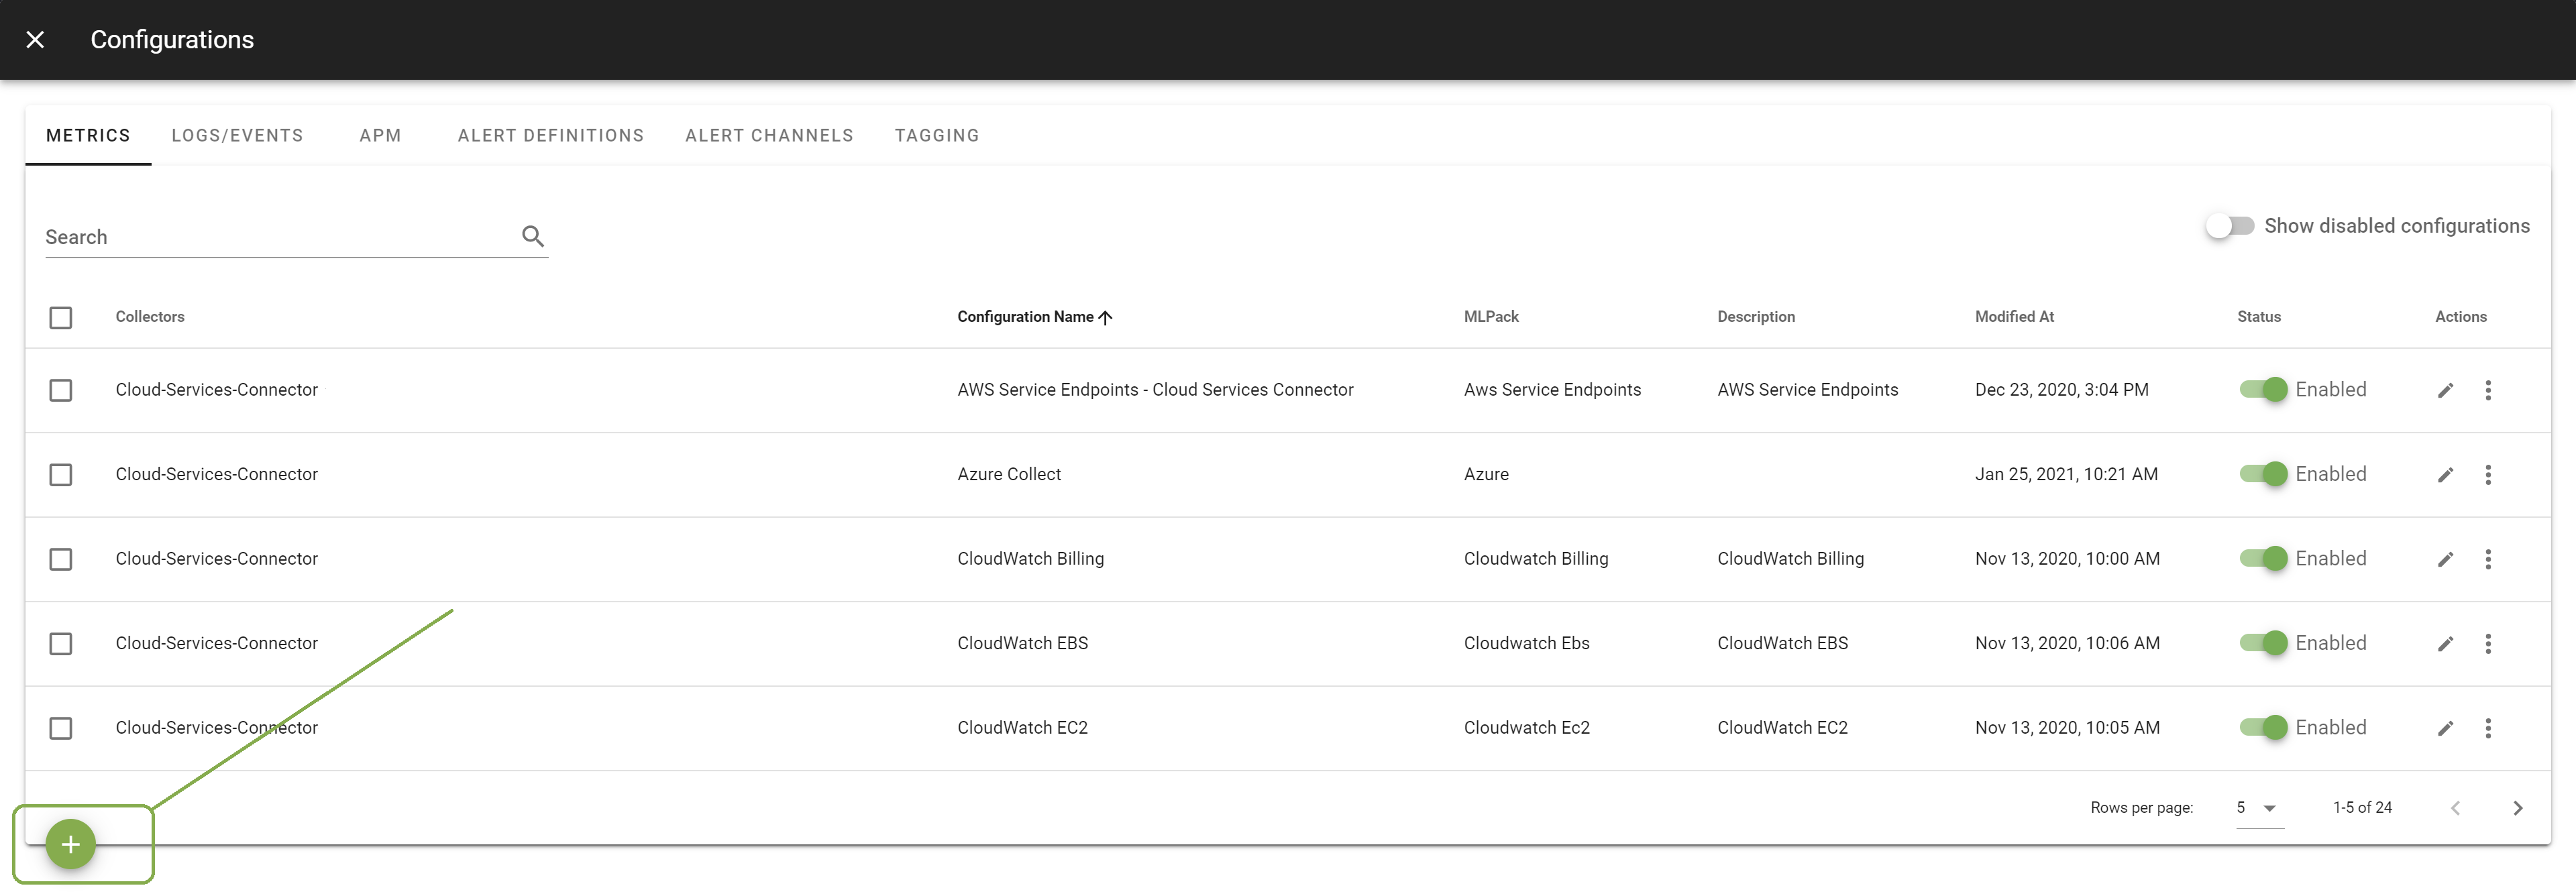
Click on the + button to add a new configuration.
Select the template Mesos. Select the Collector on which you want this configuration to be deployed; and provide a Configuration Name that is meaningful for you. The Description is optional.
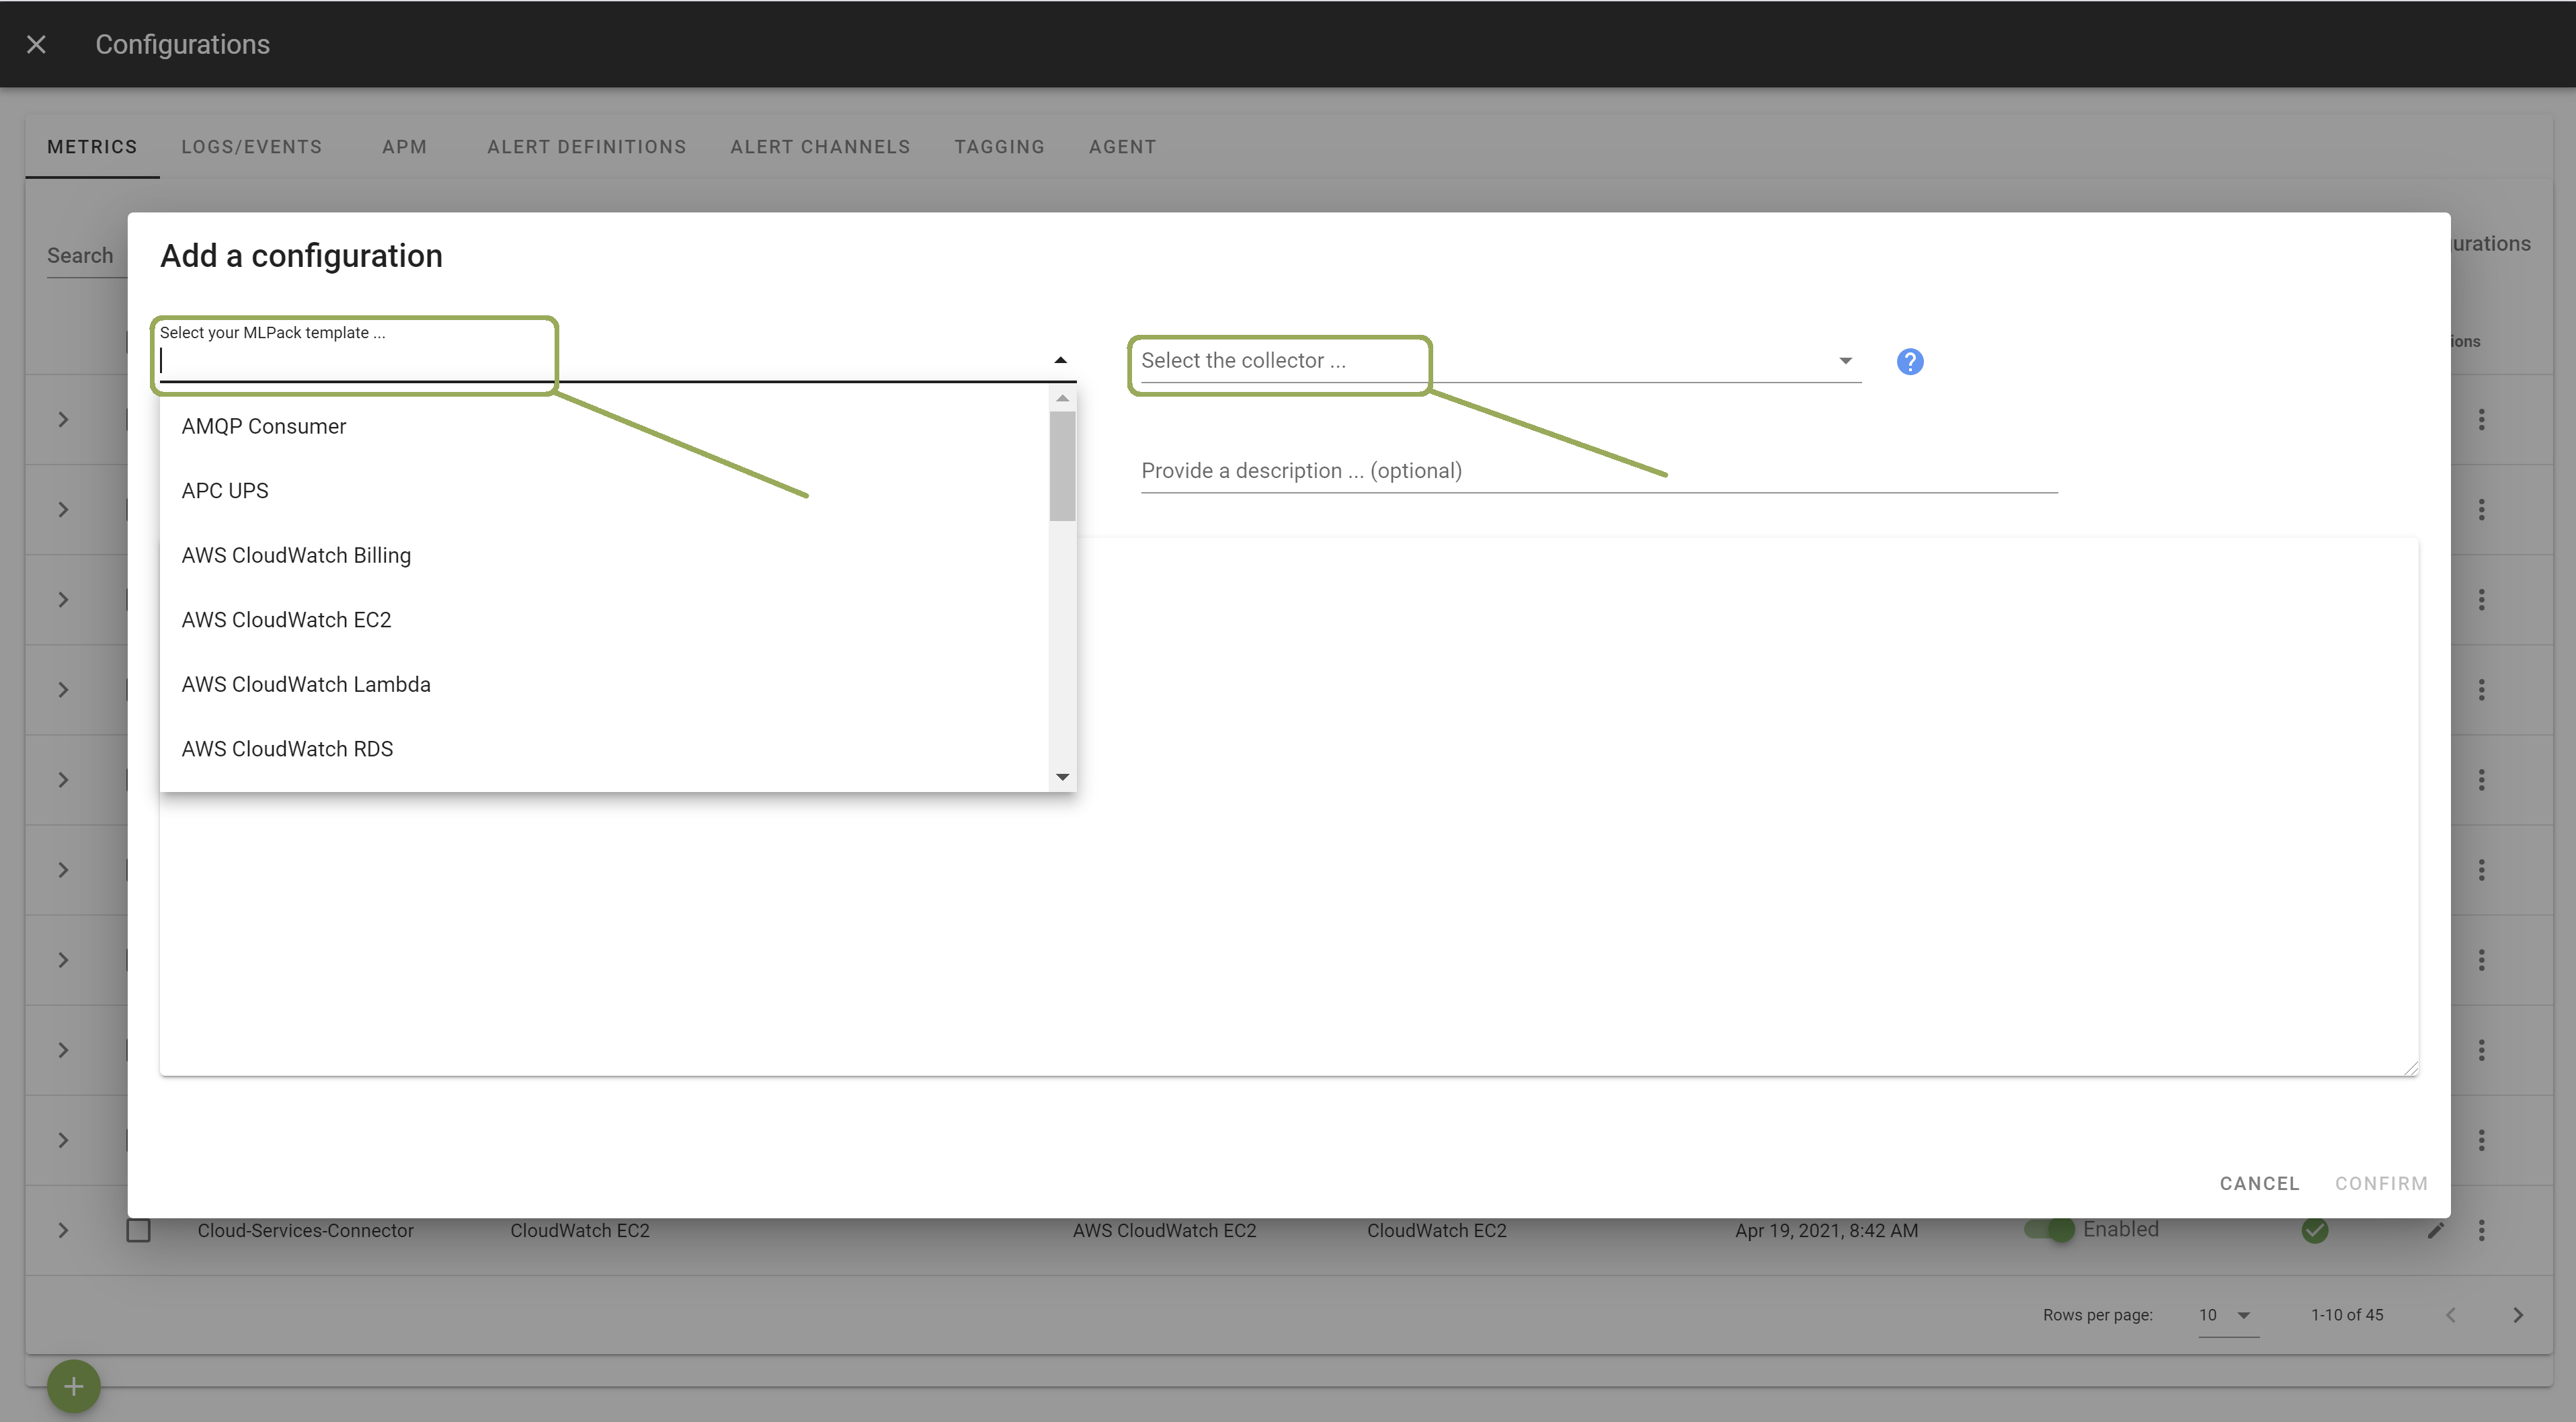
In the template, enter the correct settings for your Mesos server(s). Other configuration options are possible. Browse the template to discover them.
Once done, click Apply to start the monitoring.
Metrics#
| Categories | Metrics |
|---|---|
| Master Resources | Information about the total resources available in the cluster and their current usage. High resource usage for sustained periods of time may indicate that you need to add capacity to your cluster or that a framework is misbehaving. |
| Master Election | Elected Status, Uptime |
| Master System | Information about the resources available on this master node and their current usage. High resource usage in a master node for sustained periods of time may degrade the performance of the cluster. |
| Master Agents | Information about agent events, agent counts, and agent states. A low number of active agents may indicate that agents are unhealthy or that they are not able to connect to the elected master. |
| Master Frameworks | Information about the registered frameworks in the cluster. No active or connected frameworks may indicate that a scheduler is not registered or that it is misbehaving. |
| Master Tasks | Information about active and terminated tasks. A high rate of lost tasks may indicate that there is a problem with the cluster. The task states listed here match those of the task state machine. |
| Master Event Queue | Information about different types of events in the event queue: number of dispatches, HTTP requests, total messages, and number of subscribers to the operator event stream. |
| Master Registrar | Information about read and write latency to the agent registrar. |
| Master Messages | Information about messages between the master and the agents and between the framework and the executors. A high rate of dropped messages may indicate that there is a problem with the network. |
| Slave Resources | Information about the total resources available in the agent and their current usage. |
| Slave Registration | Registered Status, Uptime |
| Slave System | Information about the agent system: Cpu, Load and Memory Usage. |
| Slave Executors | Information about the executor instances running on the agent. |
| Slave Tasks | Information about active and terminated tasks: number of tasks failed, finished, killed, lost, running, staging and starting. |
| Slave Messages | Information about messages between the agents and the master it is registered with: number of valid/invalid framework messages, number of valid/invalid status updates. |