Juniper Networks
Juniper Networks#
Overview#
The ML Pack for Juniper Networks adds Juniper custom-metrics to the standard network monitors, with dashboard on devices system usage.
Configuration#
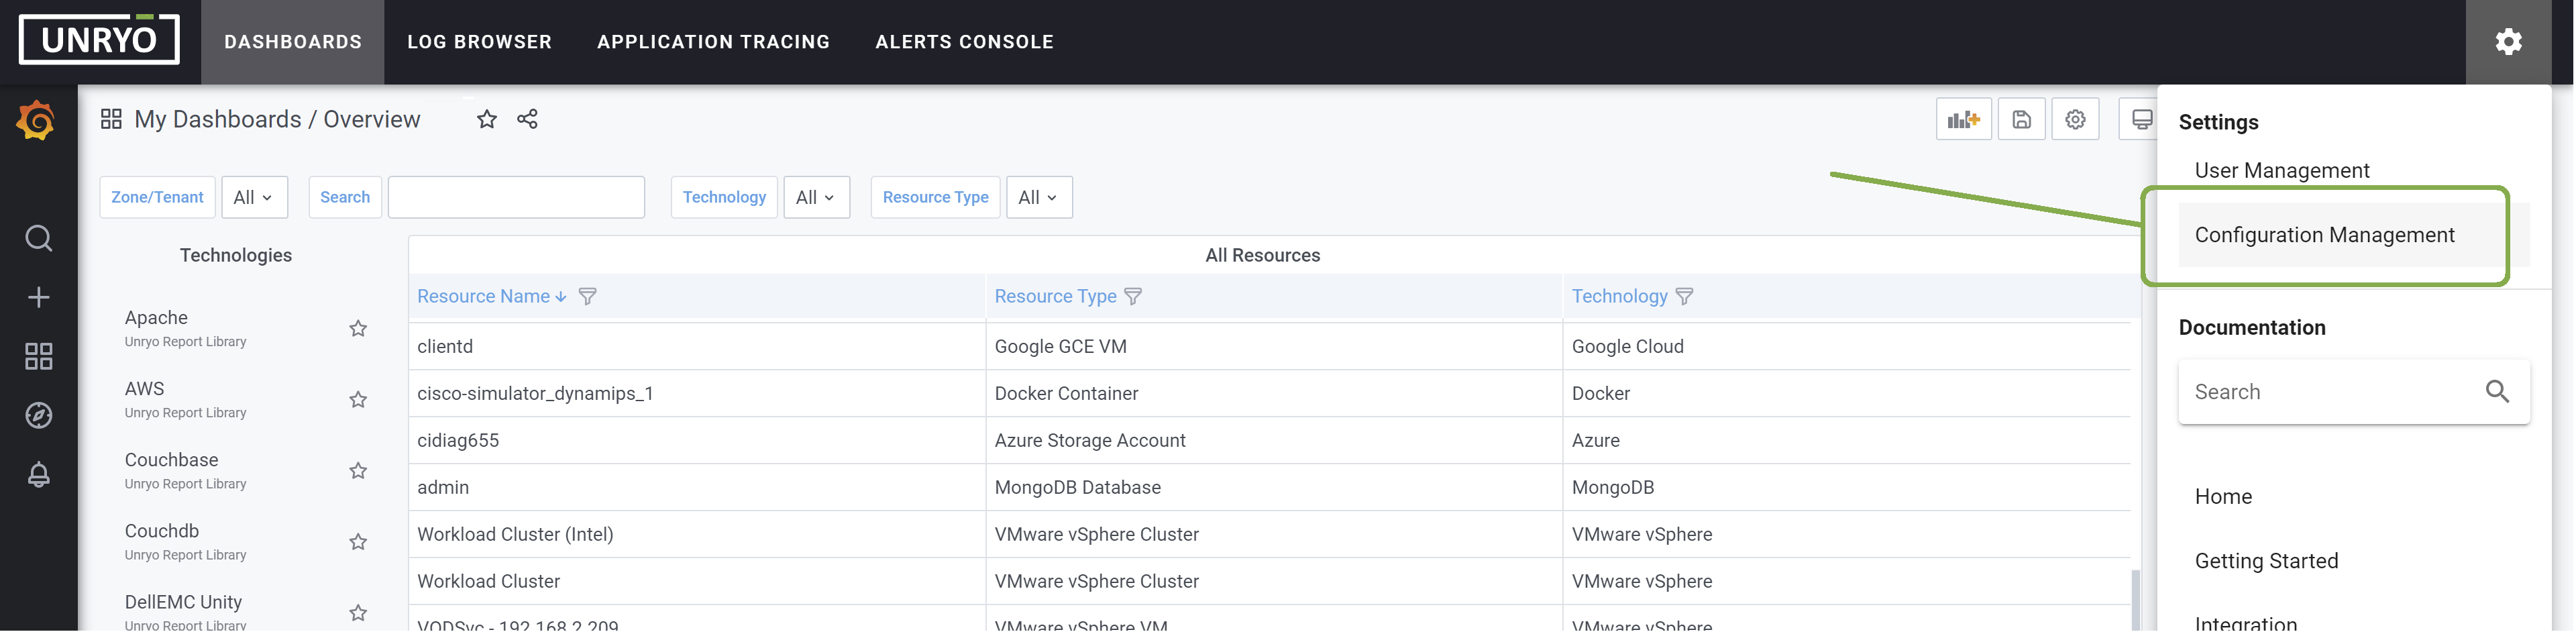
Go in Configuration Management.
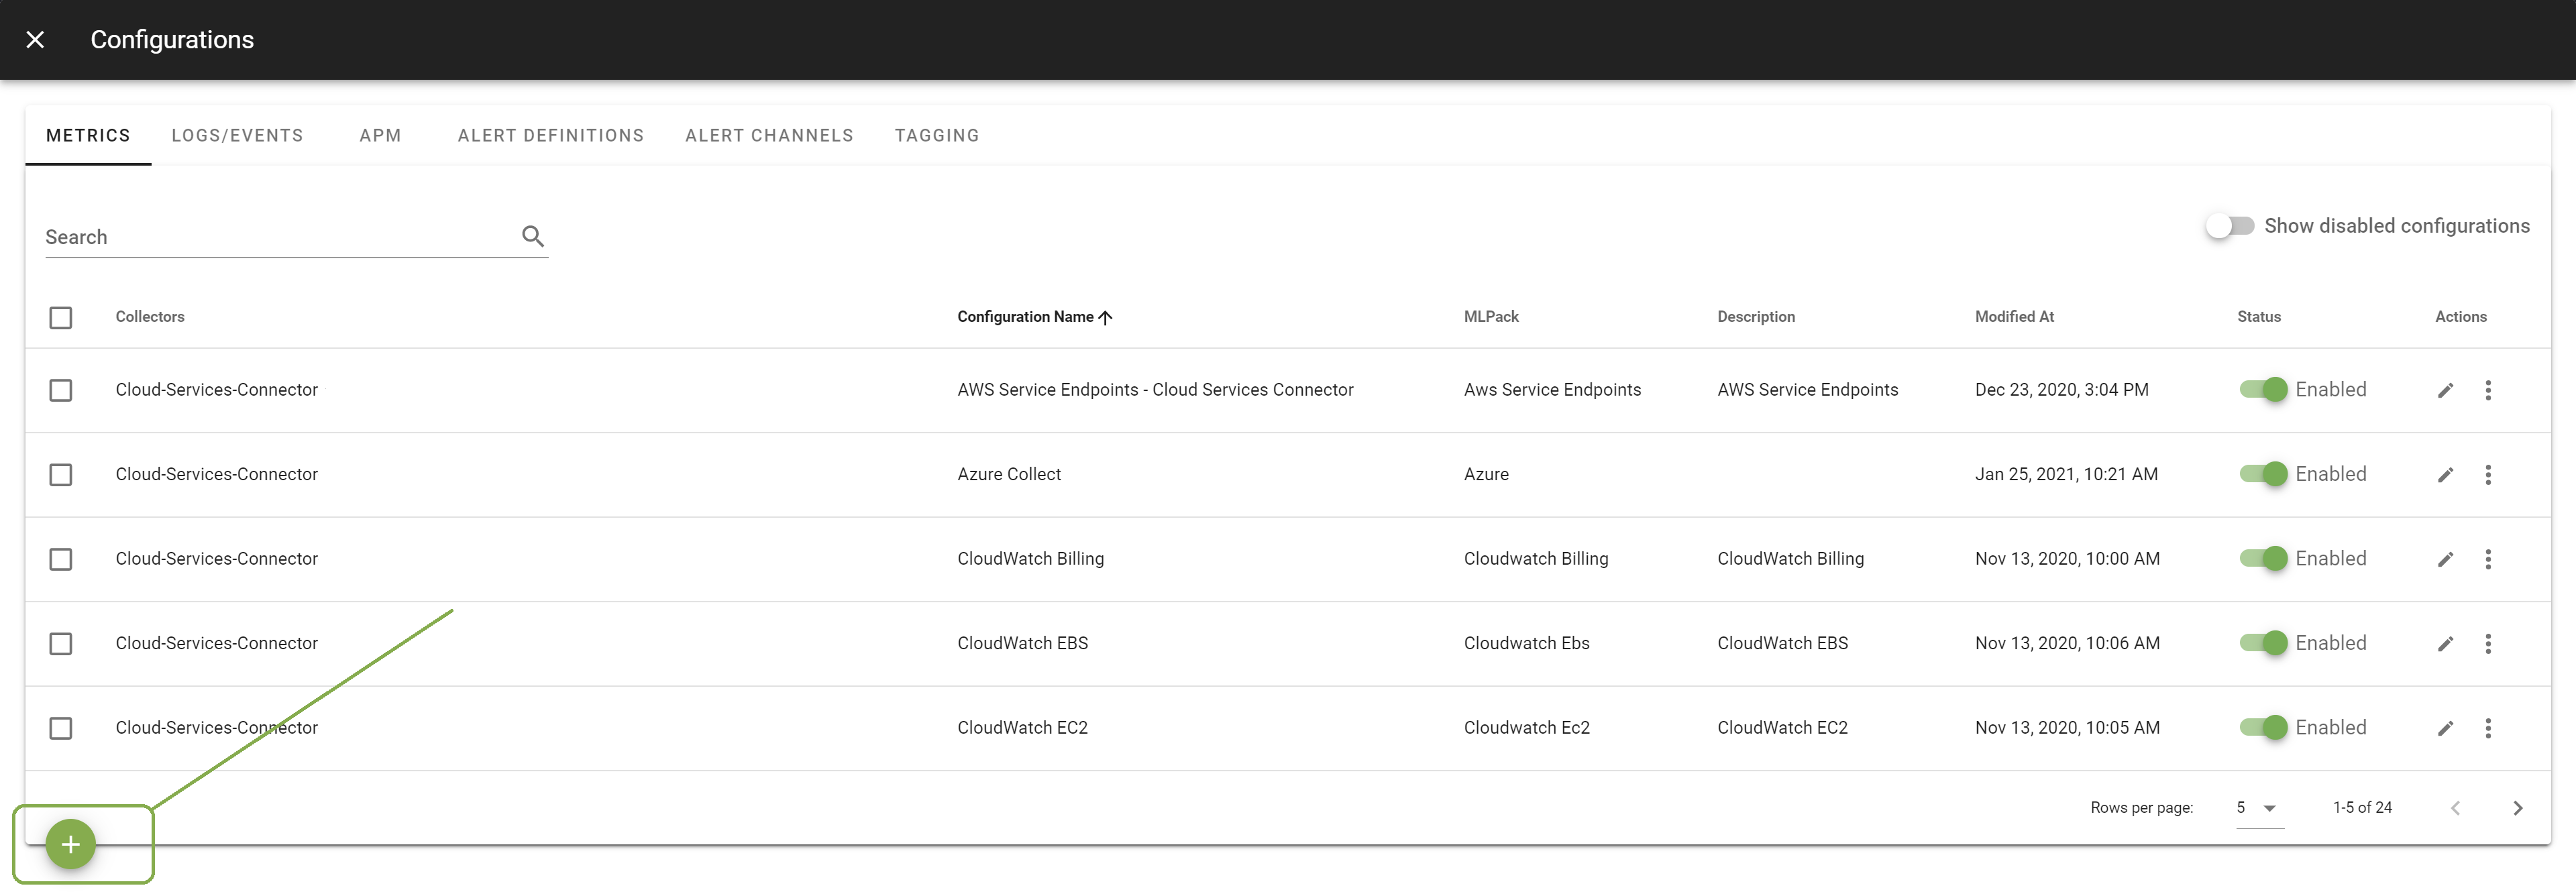
Click on the + button to add a new configuration.
Select the template Juniper. Select the Collector on which you want this configuration to be deployed; and provide a Configuration Name that is meaningful for you. The Description is optional.
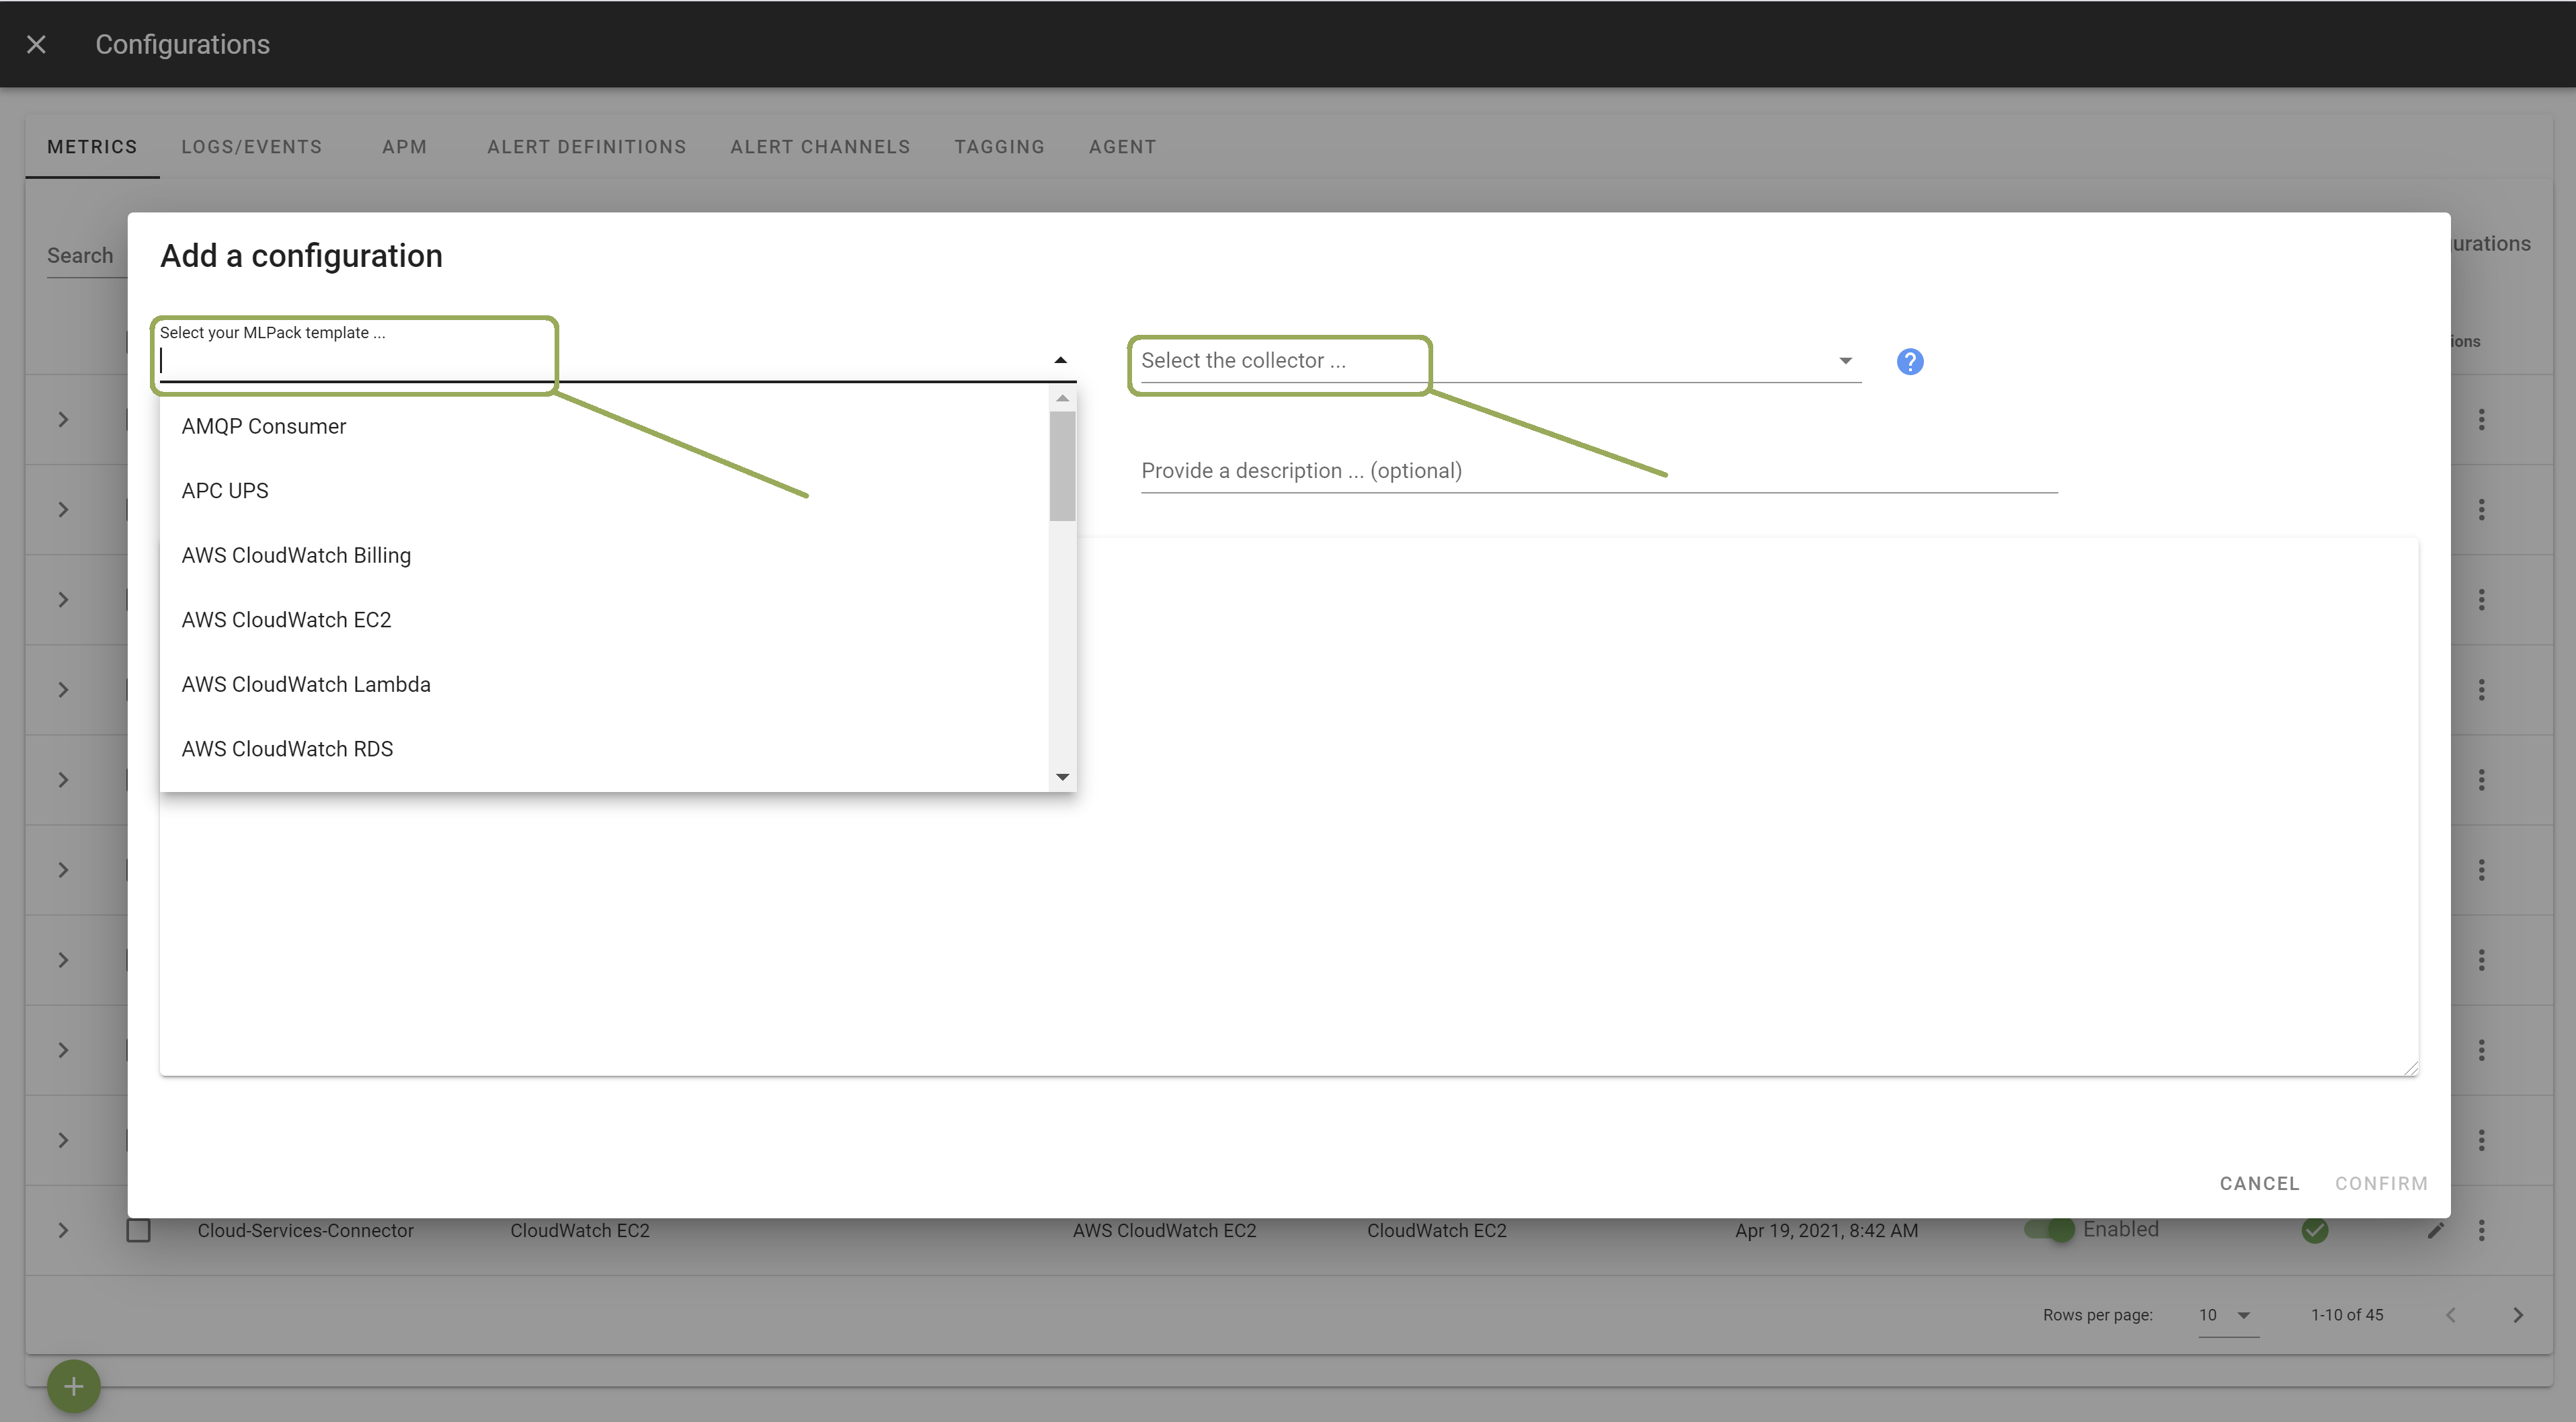
In the template, enter the correct settings for your Juniper device(s). Other configuration options are possible. Browse the template to discover them.
Once done, click Apply to start the monitoring.
Metrics#
| Categories | Metrics |
|---|---|
| Interface Traffic | In, Out, Discards, Errors, ... |
| System Usage | Device Status Alarm, Cpu Usage, Temperature, Buffer Pool Utilization, Memory, ... |