HaProxy
HaProxy#
Overview#
The ML Pack for HaProxy provides detailed visibility on how your HAProxy server is operating, with dashboards showing statistics on sessions, volume of requests, response time, queues, denies, errors, status and health states, etc.
Configuration#
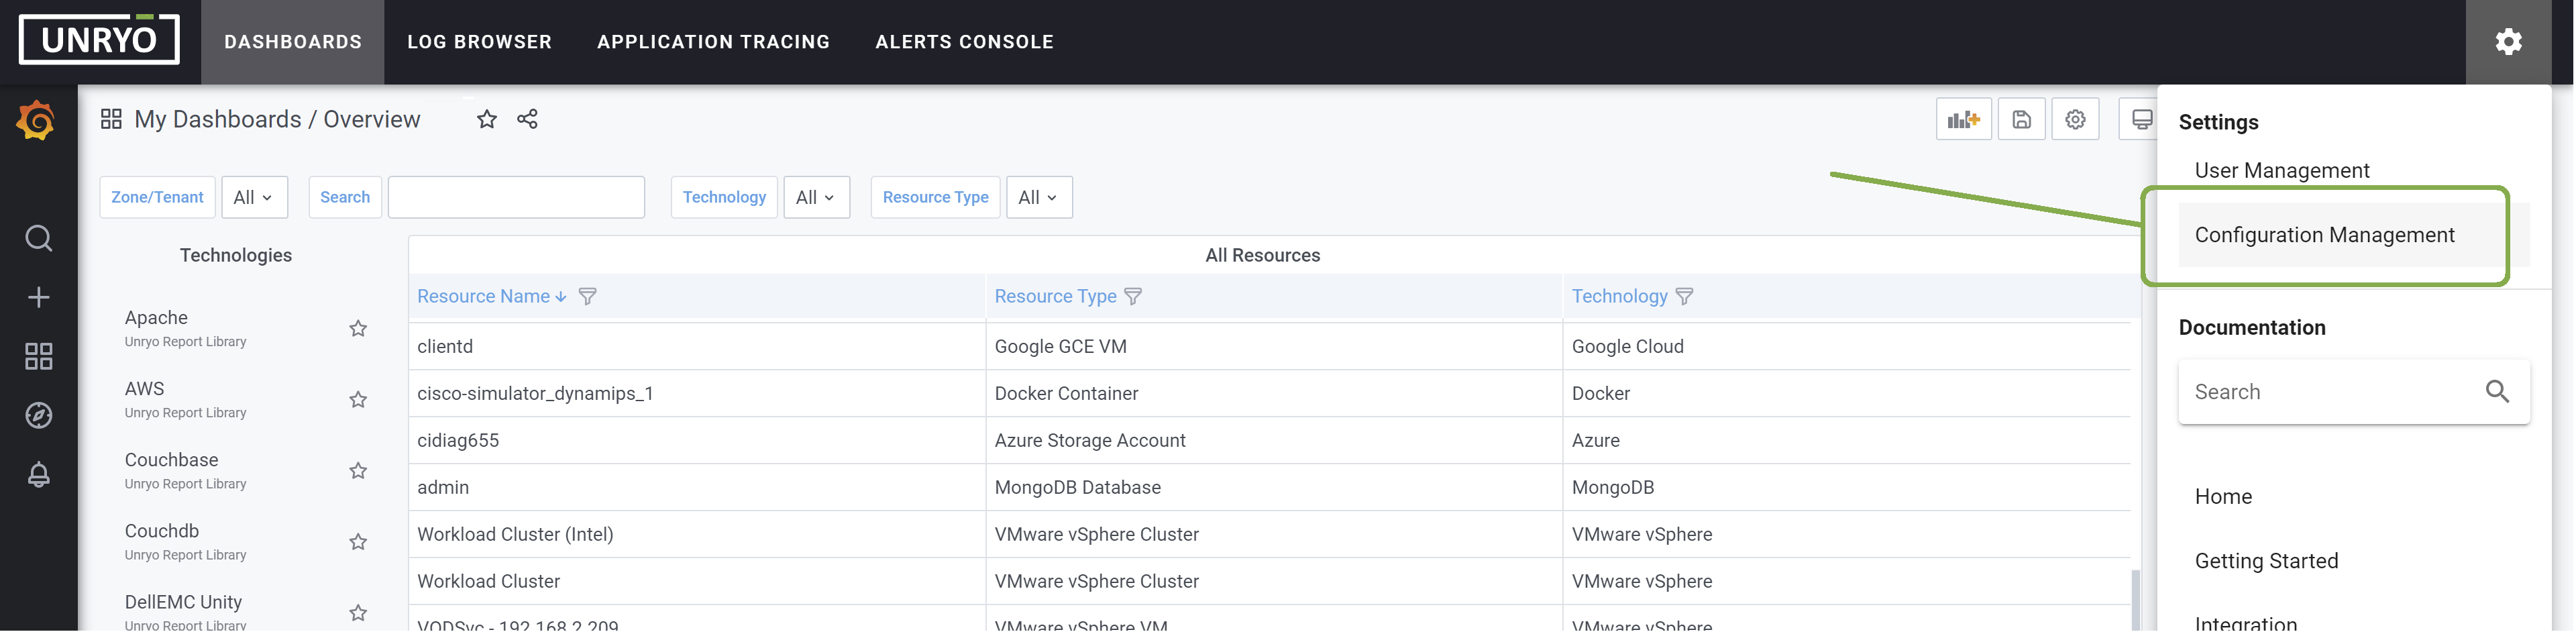
Go in Configuration Management.
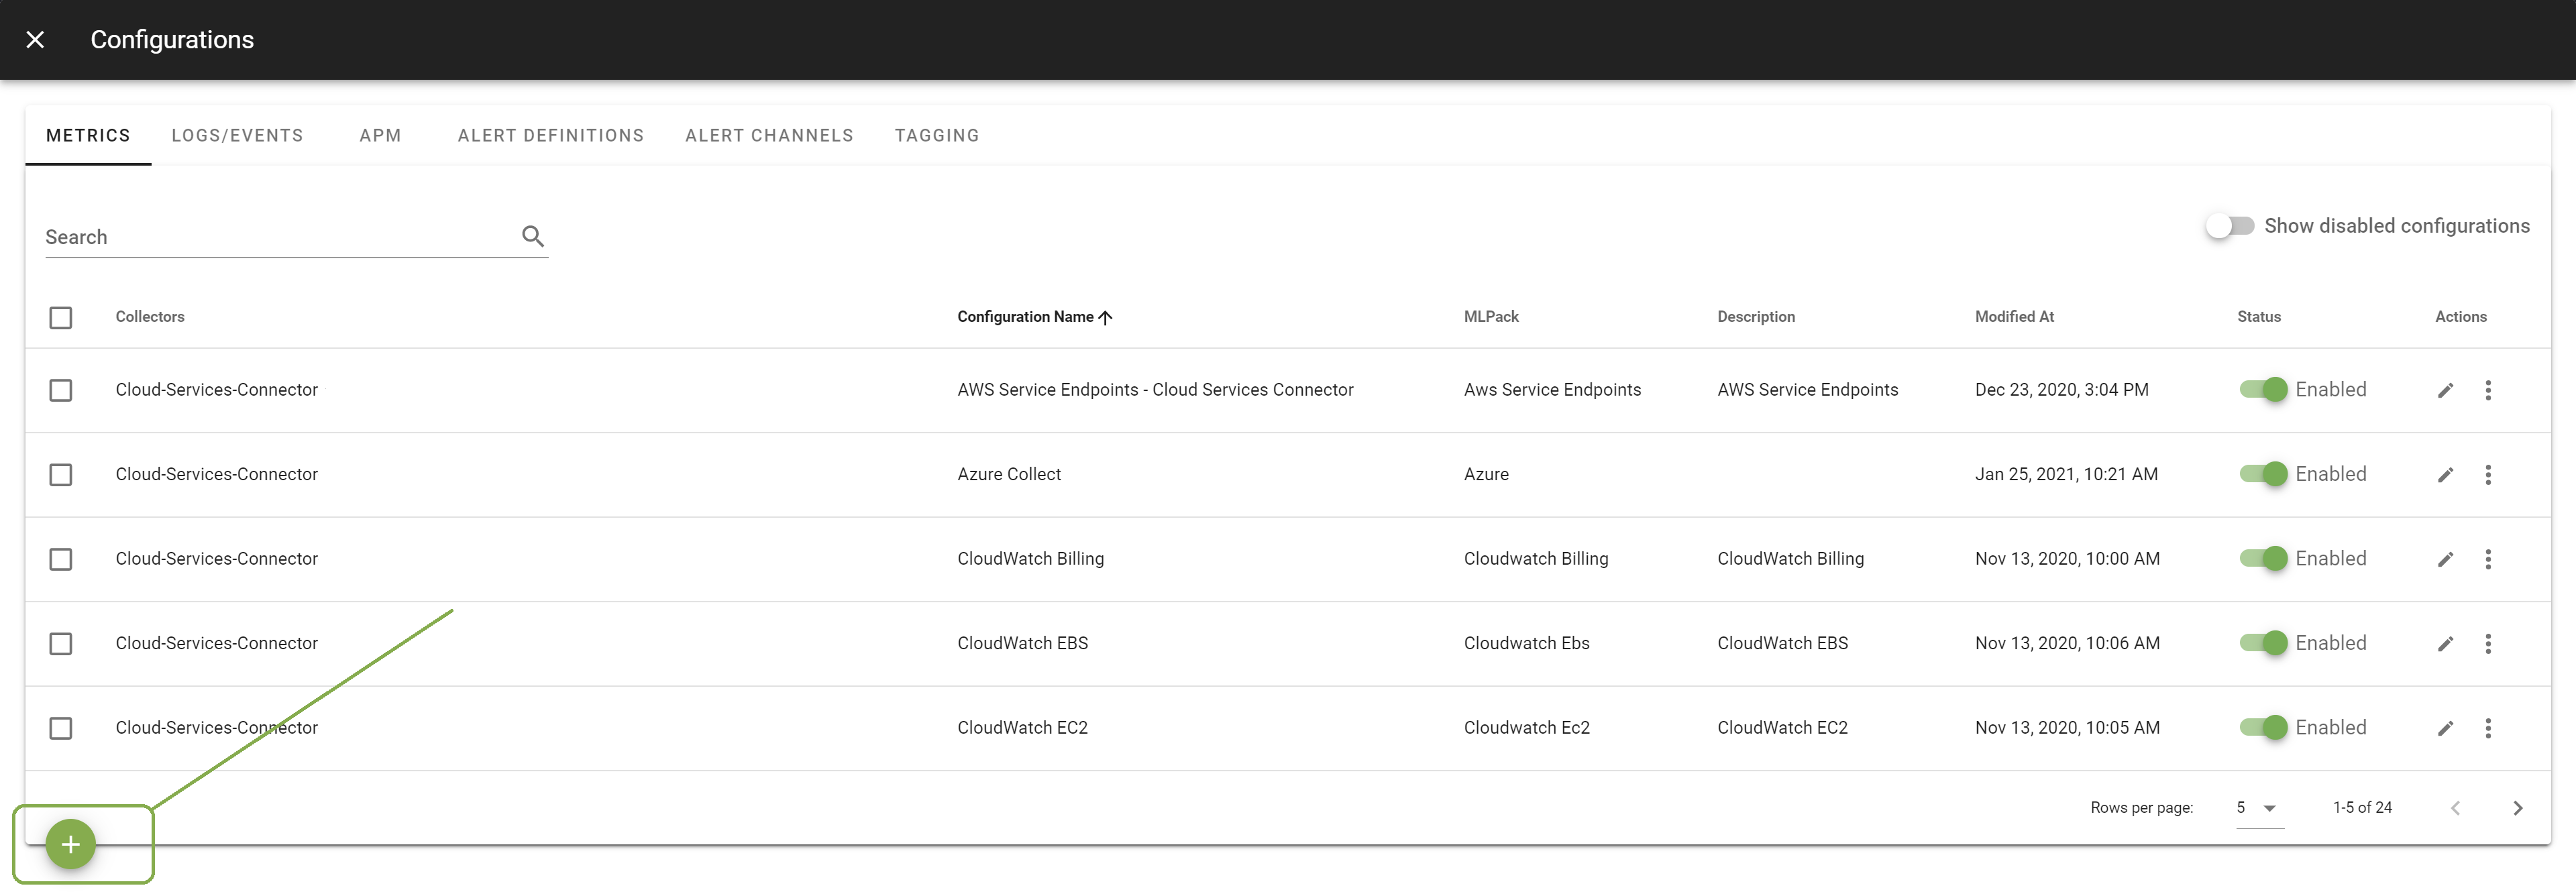
Click on the + button to add a new configuration.
Select the template Haproxy. Select the Collector on which you want this configuration to be deployed; and provide a Configuration Name that is meaningful for you. The Description is optional.
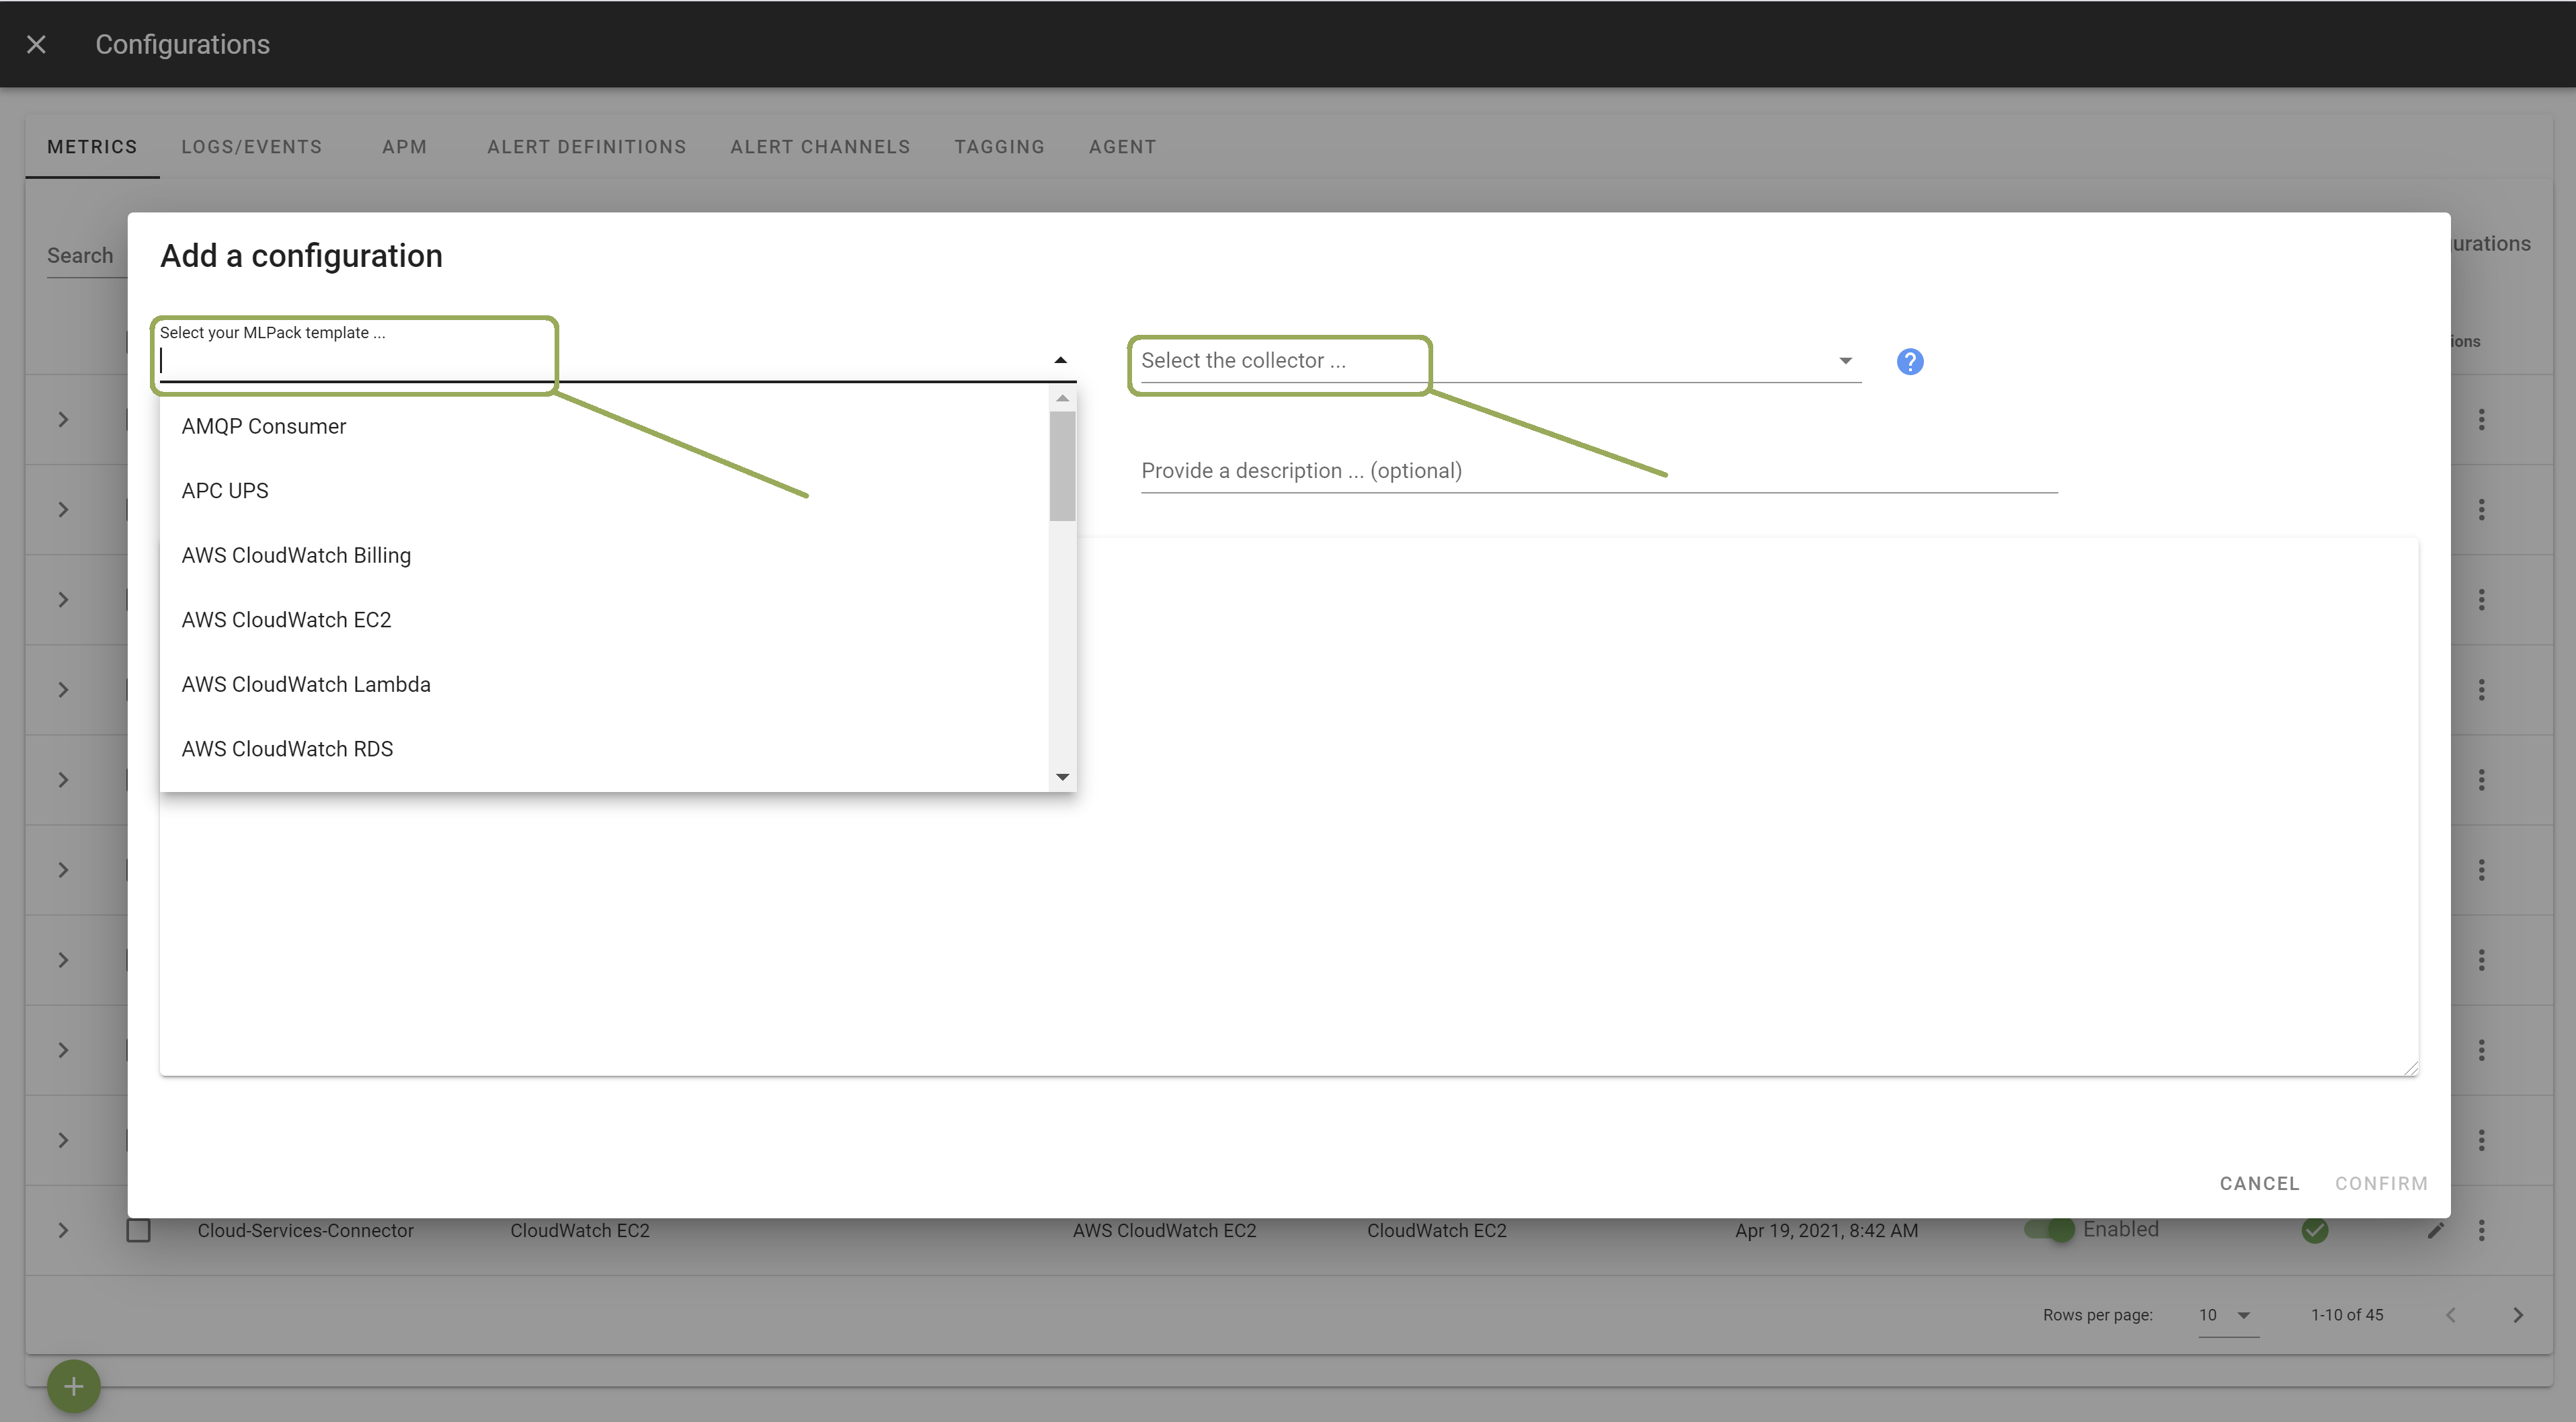
In the template, enter the correct settings for your HA Proxy server(s). Other configuration options are possible. Browse the template to discover them.
Once done, click Apply to start the monitoring.
Metrics#
- Backends status
- Sessions & Requests statistics
- HTTP response codes
- Data rates (frontend/backend traffic)