Google Cloud
Google Cloud#
Overview#
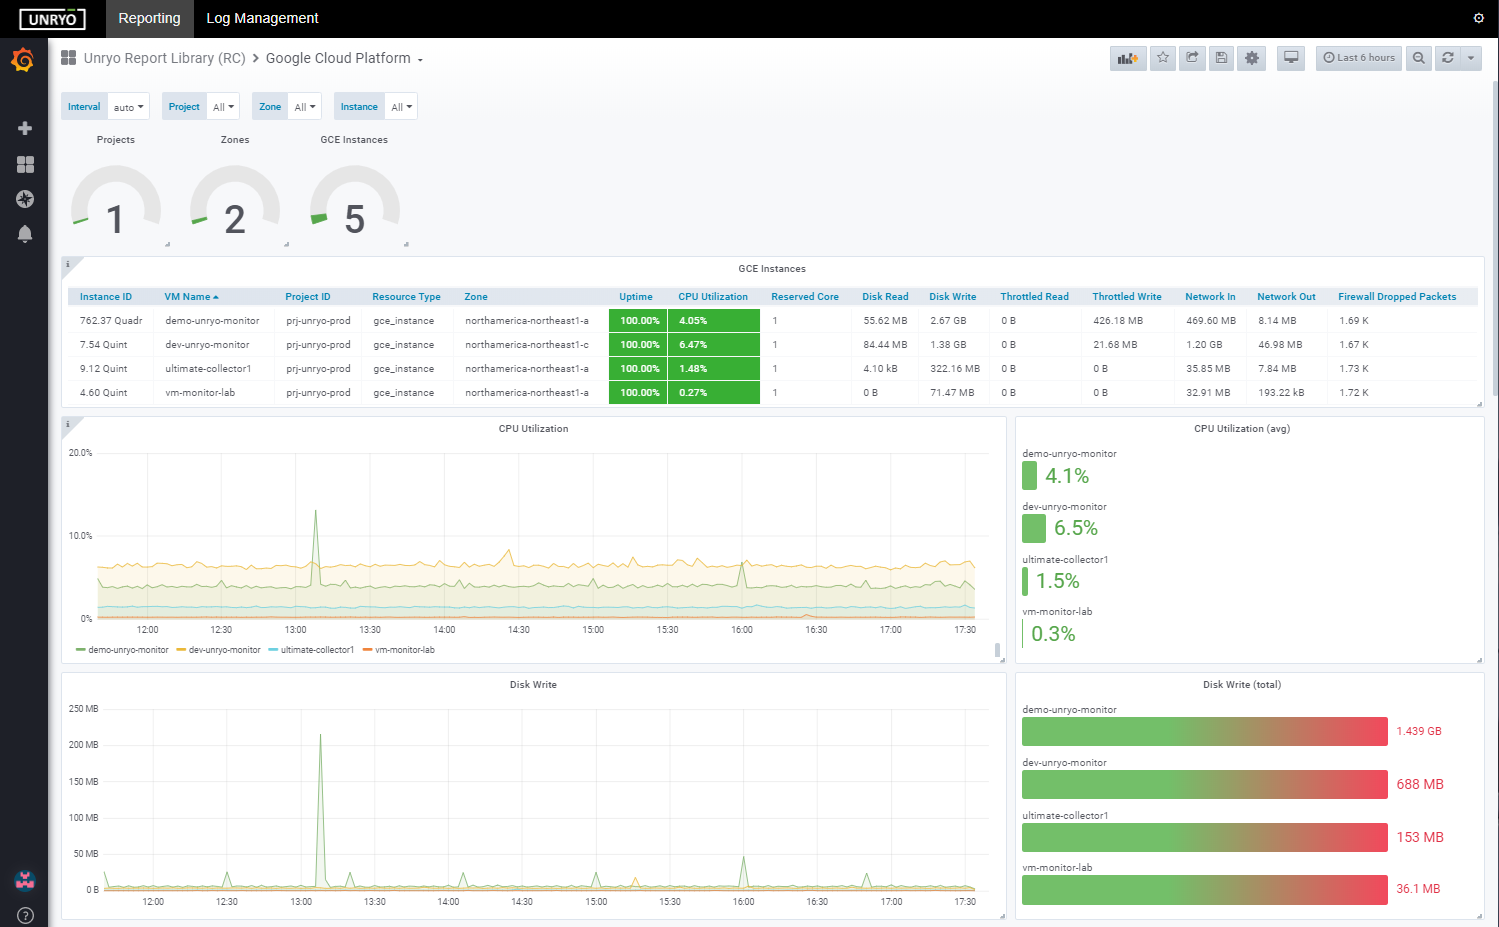
The ML Pack for Google Cloud will enable full access to all Google Cloud Stackdriver metrics.
- Compute VM processor usage over time
- Disk IO transfers by VM
- Network IO transfers by VM
- Uptime & availability of each compute VM
Note: This plugin accesses Google APIs which are chargeable; you might incur costs.

Prerequisite#
Add your GCP authentication:
In the GCP Console, go to the Create service account key page: GO THE THE SERVICE ACCOUNT KEY PAGE
- From the
Service accountlist, selectNew service account. - In the
Service account namefield, enter a name. - From the
Rolelist, selectProject > Owner. - Click
Create. A JSON file that contains your key downloads to your computer.
Open a session on your collector host, and copy the JSON file on the collector container:
docker cp your-JSON-file.JSON <container_id>:/etc/telegraf/telegraf.d/gcpaccess.json
Configuration#
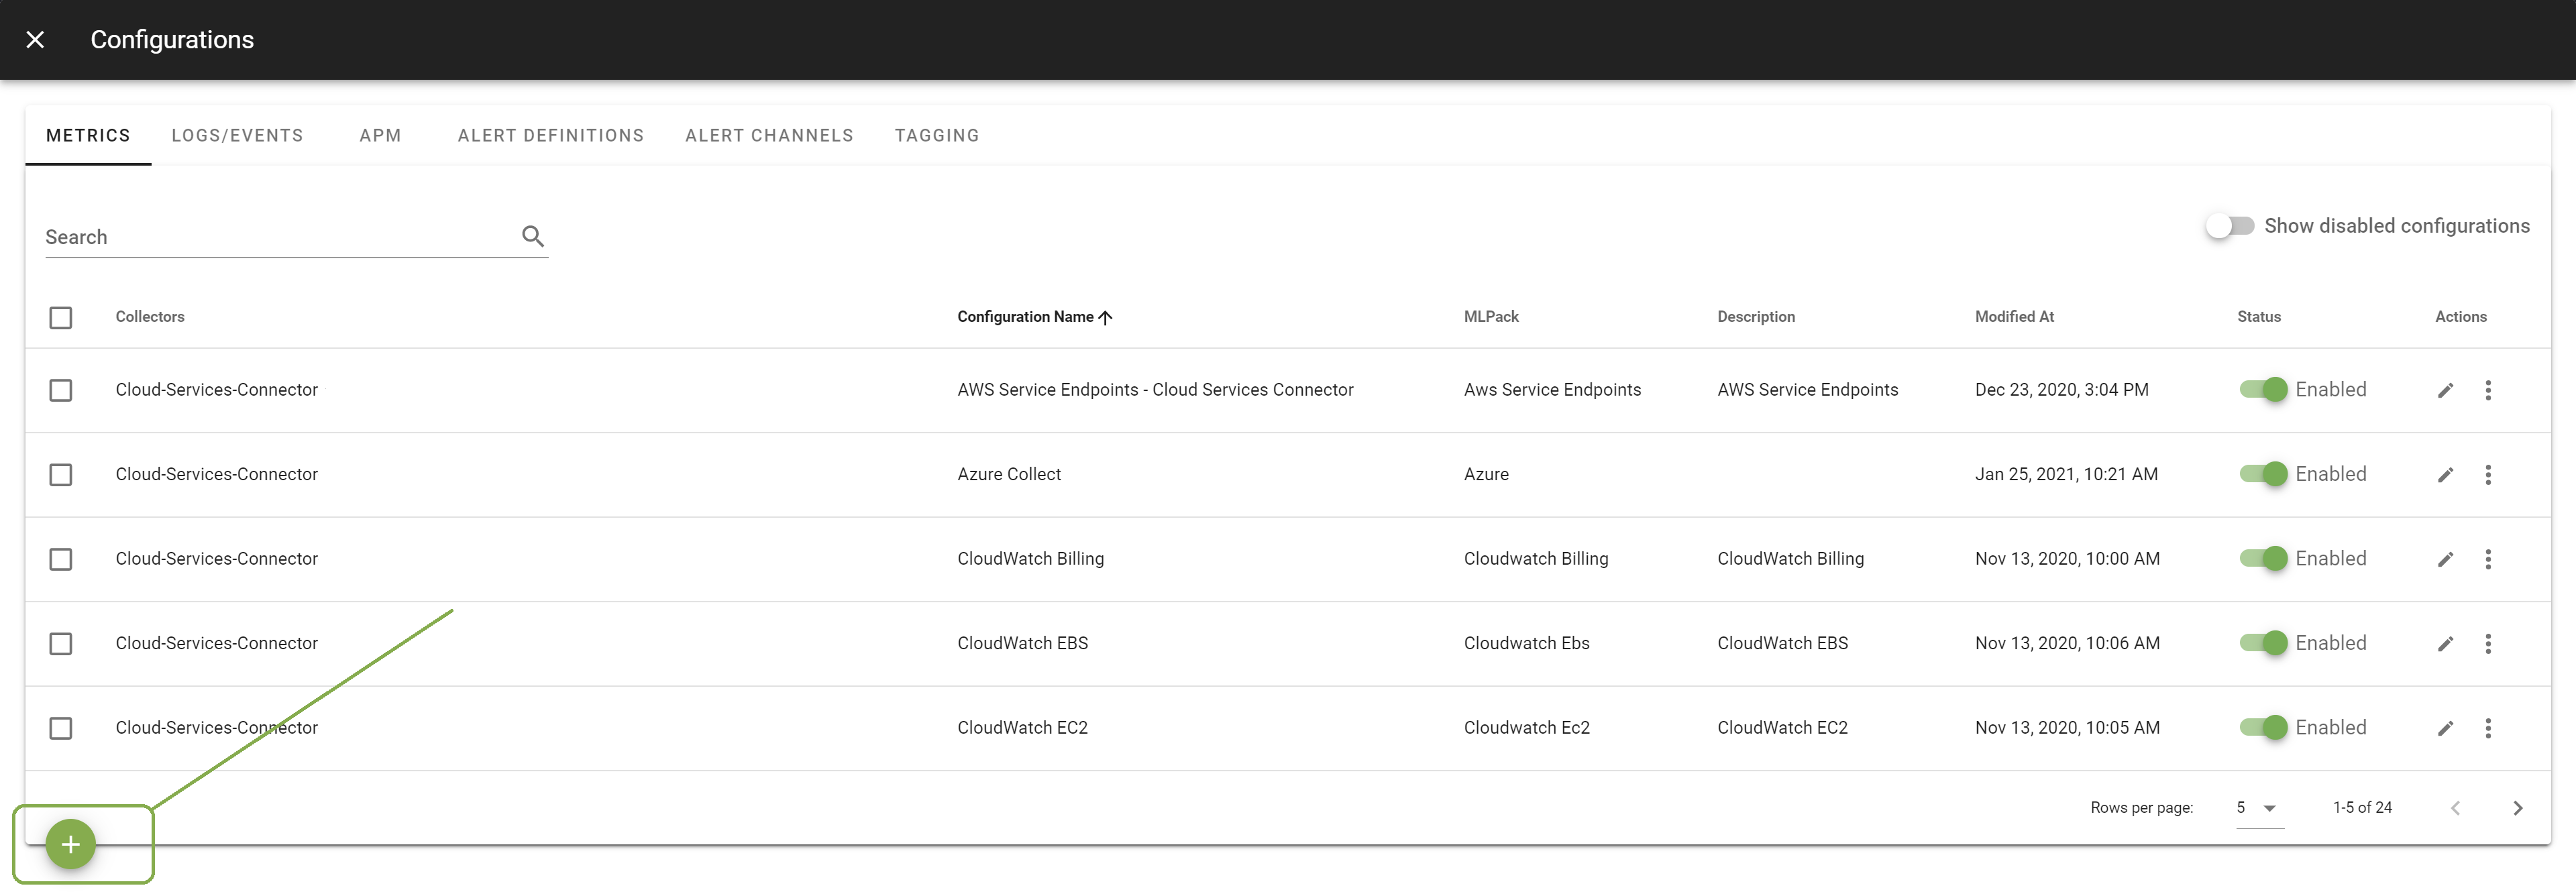
Go in Configuration Management.

Click on the + button to add a new configuration.

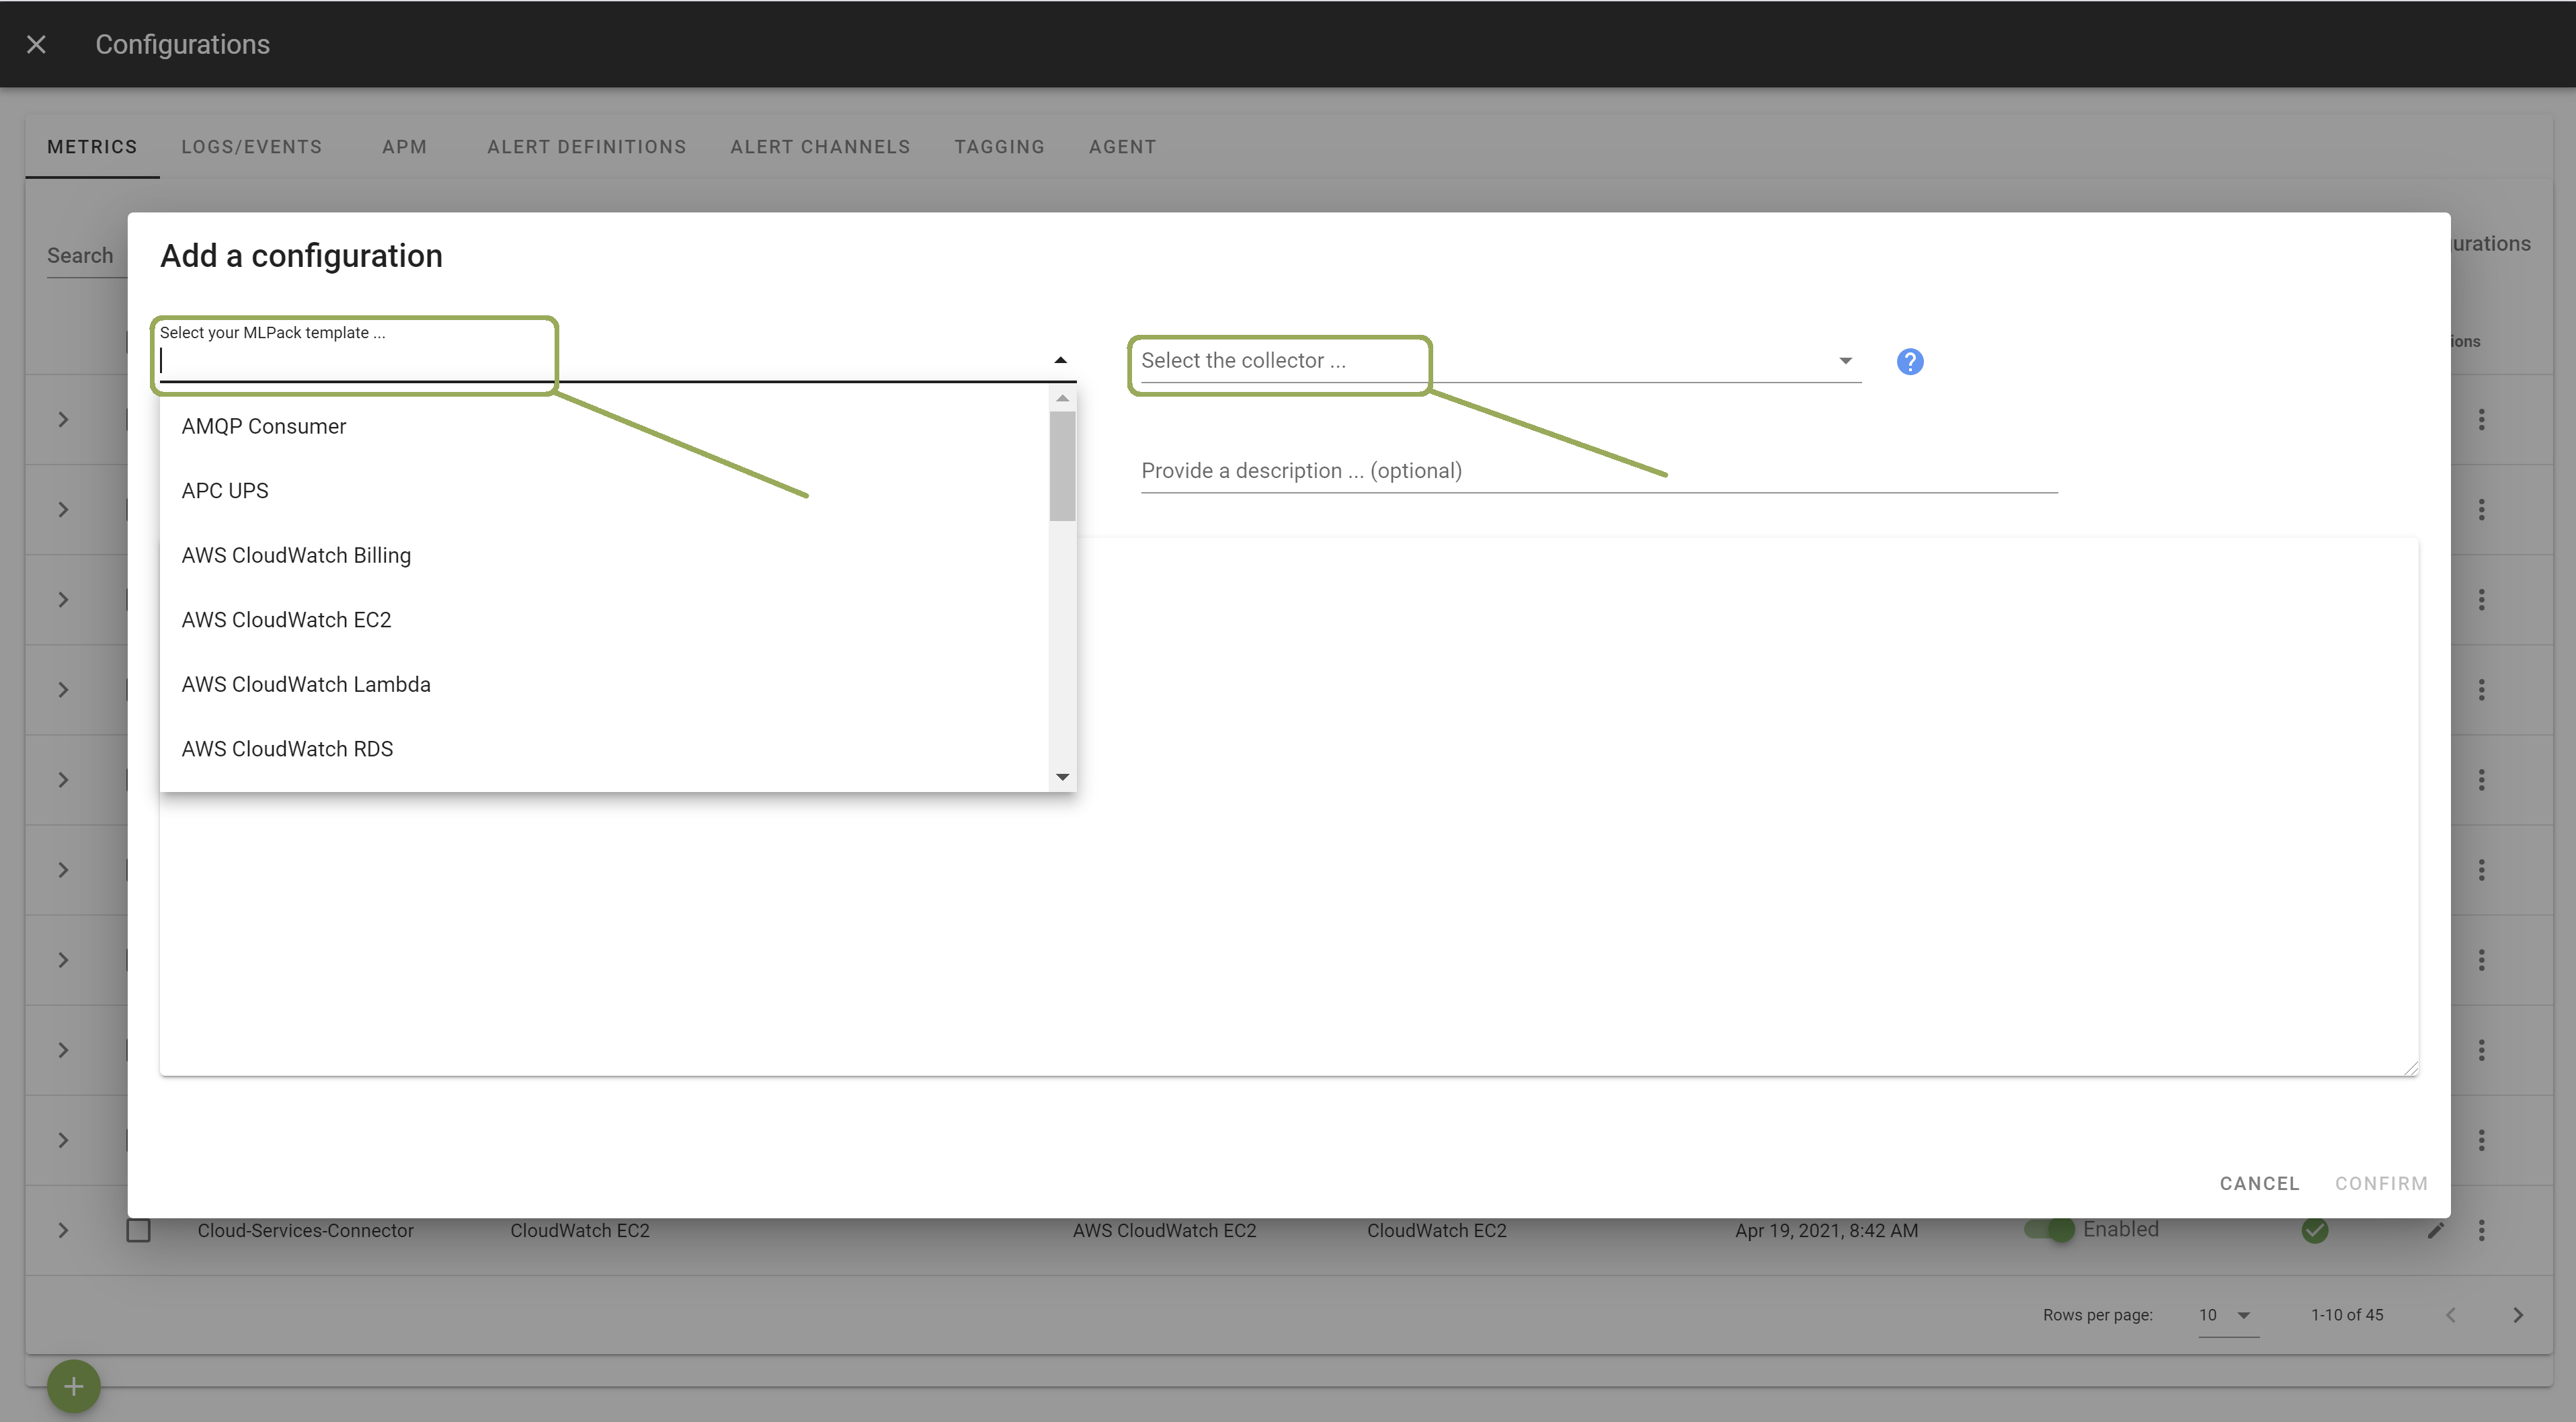
Select the template Stackdriver. Select the Collector on which you want this configuration to be deployed; and provide a Configuration Name that is meaningful for you. The Description is optional.

In the template, provide the correct settings for your GCP account.**
# Gather timeseries from Google Cloud Platform v3 monitoring API
[[inputs.stackdriver]]
  ## GCP Project
  project = "your-gcp-project"
Other configuration options are possible. Browse the template to discover them.
Once done, click Apply to start your monitoring.
Metrics#
- flex/connections/current
- flex/cpu/reserved_cores
- flex/cpu/utilization
- flex/disk/read_bytes_count
- flex/disk/write_bytes_count
- flex/instance/connections/current
- flex/instance/cpu/utilization
- flex/instance/network/received_bytes_count
- flex/instance/network/sent_bytes_count
- flex/instance/ws/avg_duration
- flex/network/received_bytes_count
- flex/network/sent_bytes_count
- http/server/dos_intercept_count
- http/server/quota_denial_count
- http/server/response_count
- http/server/response_latencies
- http/server/response_style_count
- memcache/centi_mcu_count
- memcache/operation_count
- memcache/received_bytes_count
- memcache/sent_bytes_count
- system/cpu/usage
- system/instance_count
- system/memory/usage
- system/network/received_bytes_count
- system/network/sent_bytes_count
- query/count
- query/execution_times
- query/scanned_bytes
- query/scanned_bytes_billed
- query/statement_scanned_bytes
- query/statement_scanned_bytes_billed
- slots/allocated
- slots/allocated_for_project
- slots/allocated_for_project_and_job_type
- slots/allocated_for_reservation
- slots/total_allocated_for_reservation
- slots/total_available
- storage/stored_bytes
- storage/table_count
- storage/uploaded_bytes
- storage/uploaded_bytes_billed
- storage/uploaded_row_count
- cluster/cpu_load
- cluster/cpu_load_hottest_node
- cluster/disk_load
- cluster/node_count
- cluster/storage_utilization
- disk/bytes_used
- disk/storage_capacity
- replication/latency
- replication/max_delay
- server/error_count
- server/latencies
- server/modified_rows_count
- server/received_bytes_count
- server/request_count
- server/returned_rows_count
- server/sent_bytes_count
- table/bytes_used
- function/active_instances
- function/execution_count
- function/execution_times
- function/network_egress
- function/user_memory_bytes
- device/active_devices
- device/billing_bytes_count
- device/error_count
- device/operation_count
- device/received_bytes_count
- device/sent_bytes_count
- database/auto_failover_request_count
- database/available_for_failover
- database/cpu/reserved_cores
- database/cpu/usage_time
- database/cpu/utilization
- database/disk/bytes_used
- database/disk/quota
- database/disk/read_ops_count
- database/disk/utilization
- database/disk/write_ops_count
- database/memory/quota
- database/memory/usage
- database/memory/utilization
- database/mysql/innodb_buffer_pool_pages_\dirty
- database/mysql/innodb_buffer_pool_pages_\free
- database/mysql/innodb_buffer_pool_pages_\total
- database/mysql/innodb_data_fsyncs
- database/mysql/innodb_os_log_fsyncs
- database/mysql/innodb_pages_read
- database/mysql/innodb_pages_written
- database/mysql/queries
- database/mysql/questions
- database/mysql/received_bytes_count
- database/mysql/replication/available_for_\failover
- database/mysql/replication/seconds_behind_\master
- database/mysql/replication/slave_io_\running
- database/mysql/replication/slave_sql_\running
- database/mysql/sent_bytes_count
- database/network/connections
- database/network/received_bytes_count
- database/network/sent_bytes_count
- database/postgresql/num_backends
- database/postgresql/replication/replica_\byte_lag
- database/postgresql/transaction_count
- database/state
- database/up
- database/uptime
- api/request_count
- queue/task_attempt_count
- queue/task_attempt_delays
- billing/monthly_spans_ingested
- billing/spans_ingested
- environment/api/request_count
- environment/api/request_latencies
- environment/healthy
- environment/num_celery_workers
- environment/num_workflows
- environment/task_queue_length
- workflow/run_count
- workflow/run_duration
- workflow/task/run_count
- workflow/task/run_duration
- firewall/dropped_bytes_count
- firewall/dropped_packets_count
- instance/cpu/reserved_cores
- instance/cpu/usage_time
- instance/cpu/utilization
- instance/disk/read_bytes_count
- instance/disk/read_ops_count
- instance/disk/throttled_read_bytes_count
- instance/disk/throttled_read_ops_count
- instance/disk/throttled_write_bytes_count
- instance/disk/throttled_write_ops_count
- instance/disk/write_bytes_count
- instance/disk/write_ops_count
- instance/integrity/early_boot_validation_\status
- instance/integrity/late_boot_validation_\status
- instance/network/received_bytes_count
- instance/network/received_packets_count
- instance/network/sent_bytes_count
- instance/network/sent_packets_count
- instance/uptime
- container/accelerator/duty_cycle
- container/accelerator/memory_total
- container/accelerator/memory_used
- container/accelerator/request
- container/cpu/reserved_cores
- container/cpu/usage_time
- container/cpu/utilization
- container/disk/bytes_total
- container/disk/bytes_used
- container/memory/bytes_total
- container/memory/bytes_used
- container/memory/page_fault_count
- container/uptime
- job/billable_shuffle_data_processed
- job/current_num_vcpus
- job/current_shuffle_slots
- job/data_watermark_age
- job/elapsed_time
- job/element_count
- job/estimated_byte_count
- job/is_failed
- job/status
- job/system_lag
- job/total_memory_usage_time
- job/total_pd_usage_time
- job/total_shuffle_data_processed
- job/total_streaming_data_processed
- job/total_vcpu_time
- job/user_counter
- cluster/hdfs/datanodes
- cluster/hdfs/storage_capacity
- cluster/hdfs/storage_utilization
- cluster/hdfs/unhealthy_blocks
- cluster/job/completion_time
- cluster/job/duration
- cluster/job/failed_count
- cluster/job/running_count
- cluster/job/submitted_count
- cluster/operation/completion_time
- cluster/operation/duration
- cluster/operation/failed_count
- cluster/operation/running_count
- cluster/operation/submitted_count
- cluster/yarn/allocated_memory_percentage
- cluster/yarn/apps
- cluster/yarn/containers
- cluster/yarn/memory_size
- cluster/yarn/nodemanagers
- cluster/yarn/pending_memory_size
- cluster/yarn/virtual_cores
- api/request_count
- entity/read_sizes
- entity/write_sizes
- index/write_count
- query/response_count
- nfs/server/free_bytes
- nfs/server/free_bytes_percent
- nfs/server/procedure_call_count
- nfs/server/read_bytes_count
- nfs/server/read_milliseconds_count
- nfs/server/read_ops_count
- nfs/server/used_bytes
- nfs/server/used_bytes_percent
- nfs/server/write_bytes_count
- nfs/server/write_milliseconds_count
- nfs/server/write_ops_count
- io/database_load
- io/persisted_bytes_count
- io/sent_responses_count
- io/utilization
- GA I/O utilization
- network/active_connections
- network/api_hits_count
- network/broadcast_load
- network/disabled_for_overages
- network/https_requests_count
- network/monthly_sent
- network/monthly_sent_limit
- network/sent_bytes_count
- network/sent_payload_and_protocol_bytes_\count
- network/sent_payload_bytes_count
- storage/disabled_for_overages
- storage/limit
- storage/total_bytes
- network/monthly_sent
- network/monthly_sent_limit
- network/sent_bytes_count
- storage/limit
- storage/total_bytes
- document/delete_count
- document/read_count
- document/write_count
- network/attachment/capacity
- network/attachment/received_bytes_count
- network/attachment/received_packets_count
- network/attachment/sent_bytes_count
- network/attachment/sent_packets_count
- network/interconnect/capacity
- network/interconnect/dropped_packets_count
- network/interconnect/link/operational
- network/interconnect/link/rx_power
- network/interconnect/link/tx_power
- network/interconnect/operational
- network/interconnect/receive_errors_count
- network/interconnect/received_bytes_count
- network/interconnect/received_unicast_\packets_count
- network/interconnect/send_errors_count
- network/interconnect/sent_bytes_count
- network/interconnect/sent_unicast_packets_\count
- https/backend_latencies
- https/backend_request_bytes_count
- https/backend_request_count
- https/backend_response_bytes_count
- https/frontend_tcp_rtt
- https/request_bytes_count
- https/request_count
- https/response_bytes_count
- https/total_latencies
- l3/internal/egress_bytes_count
- l3/internal/egress_packets_count
- l3/internal/ingress_bytes_count
- l3/internal/ingress_packets_count
- l3/internal/rtt_latencies
- tcp_ssl_proxy/closed_connections
- tcp_ssl_proxy/egress_bytes_count
- tcp_ssl_proxy/frontend_tcp_rtt
- tcp_ssl_proxy/ingress_bytes_count
- tcp_ssl_proxy/new_connections
- tcp_ssl_proxy/open_connections
- billing/bytes_ingested
- billing/monthly_bytes_ingested
- exports/byte_count
- exports/error_count
- exports/log_entry_count
- prediction/error_count
- prediction/latencies
- prediction/prediction_count
- prediction/response_count
- training/accelerator/memory/utilization
- training/accelerator/utilization
- training/cpu/utilization
- training/memory/utilization
- training/network/received_bytes_count
- training/network/sent_bytes_count
- billing/bytes_ingested
- stats/num_time_series
- uptime_check/check_passed
- uptime_check/content_mismatch
- uptime_check/error_code
- uptime_check/http_status
- uptime_check/request_latency
- snapshot/backlog_bytes
- snapshot/backlog_bytes_by_region
- snapshot/config_updates_count
- snapshot/num_messages
- snapshot/num_messages_by_region
- snapshot/oldest_message_age
- snapshot/oldest_message_age_by_region
- subscription/backlog_bytes
- subscription/byte_cost
- subscription/config_updates_count
- subscription/mod_ack_deadline_message_\operation_count
- subscription/mod_ack_deadline_request_\count
- subscription/num_outstanding_messages
- subscription/num_retained_acked_messages
- subscription/num_retained_acked_messages_\by_region
- subscription/num_unacked_messages_by_\region
- subscription/num_undelivered_messages
- subscription/oldest_retained_acked_\message_age
- subscription/oldest_retained_acked_\message_age_by_region
- subscription/oldest_unacked_message_age
- subscription/oldest_unacked_message_age_\by_region
- subscription/pull_ack_message_operation_\count
- subscription/pull_ack_request_count
- subscription/pull_message_operation_count
- subscription/pull_request_count
- subscription/push_request_count
- subscription/push_request_latencies
- subscription/retained_acked_bytes
- subscription/retained_acked_bytes_by_\region
- subscription/seek_request_count
- subscription/streaming_pull_ack_message_\operation_count
- subscription/streaming_pull_ack_request_\count
- subscription/streaming_pull_message_\operation_count
- subscription/streaming_pull_mod_ack_\deadline_message_operation_count
- subscription/streaming_pull_mod_ack_\deadline_request_count
- subscription/streaming_pull_response_count
- subscription/unacked_bytes_by_region
- topic/byte_cost
- topic/config_updates_count
- topic/message_sizes
- topic/num_retained_acked_messages_by_\region
- topic/num_unacked_messages_by_region
- topic/oldest_retained_acked_message_age_\by_region
- topic/oldest_unacked_message_age_by_region
- topic/retained_acked_bytes_by_region
- topic/send_message_operation_count
- topic/send_request_count
- topic/unacked_bytes_by_region
- clients/blocked
- clients/connected
- commands/calls
- commands/total_time
- commands/usec_per_call
- keyspace/avg_ttl
- keyspace/keys
- keyspace/keys_with_expiration
- persistence/rdb/bgsave_in_progress
- replication/master/slaves/lag
- replication/master/slaves/offset
- replication/master_repl_offset
- replication/offset_diff
- replication/role
- server/uptime
- stats/cache_hit_ratio
- stats/connections/total
- stats/cpu_utilization
- stats/evicted_keys
- stats/expired_keys
- stats/keyspace_hits
- stats/keyspace_misses
- stats/memory/maxmemory
- stats/memory/system_memory_usage_ratio
- stats/memory/usage
- stats/memory/usage_ratio
- stats/network_traffic
- stats/pubsub/channels
- stats/pubsub/patterns
- stats/reject_connections_count
- bgp/received_routes_count
- bgp/sent_routes_count
- bgp/session_up
- container/cpu/allocation_time
- container/memory/allocation_time
- api/request_count
- api/request_latencies
- api/request_latencies_backend
- api/request_latencies_overhead
- api/request_sizes
- api/response_sizes
- quota/allocation/usage
- quota/exceeded
- quota/limit
- quota/rate/net_usage
- api/api_request_count
- api/received_bytes_count
- api/request_count
- GAUGE, DOUBLE, 1/s
- api/request_latencies
- api/sent_bytes_count
- instance/cpu/smoothed_utilization
- instance/cpu/utilization
- instance/cpu/utilization_by_priority
- instance/node_count
- instance/session_count
- instance/storage/used_bytes
- api/request_count
- authz/acl_based_object_access_count
- authz/object_specific_acl_mutation_count
- network/received_bytes_count
- network/sent_bytes_count
- storage/object_count
- storage/total_byte_seconds
- storage/total_bytes
- cpu/utilization
- memory/usage
- network/received_bytes_count
- network/sent_bytes_count
- gateway/connections
- network/dropped_received_packets_count
- network/dropped_sent_packets_count
- network/received_bytes_count
- network/received_packets_count
- network/sent_bytes_count
- network/sent_packets_count