Amazon CloudWatch
Amazon CloudWatch#
Overview#
The ML Pack for Amazon CloudWatch utilizes the CloudWatch API to pull metrics and dimension data from your AWS services. Prebuilt dashboards and alerts are available to monitor the performance and health of major AWS services including EC2, EBS, ECS, S3, RDS, Redshift and more.
Billing data is also collected to provide a consolidated cost view across your AWS services and linked accounts. You can also track AWS endpoints using synthetic HTTP checks.
Prerequisites#
Amazon Authentication: Credentials are loaded in the following order 1) Assumed credentials via STS if role_arn is specified 2) explicit credentials from 'access_key' and 'secret_key' 3) shared profile from 'profile' 4) environment variables 5) shared credentials file 6) EC2 Instance Profile
To collect billing data, you need to enable the monitoring of estimated charges from in your AWS account.
Standard AWS CloudWatch API usage incurs cost - see AWS CloudWatch Pricing
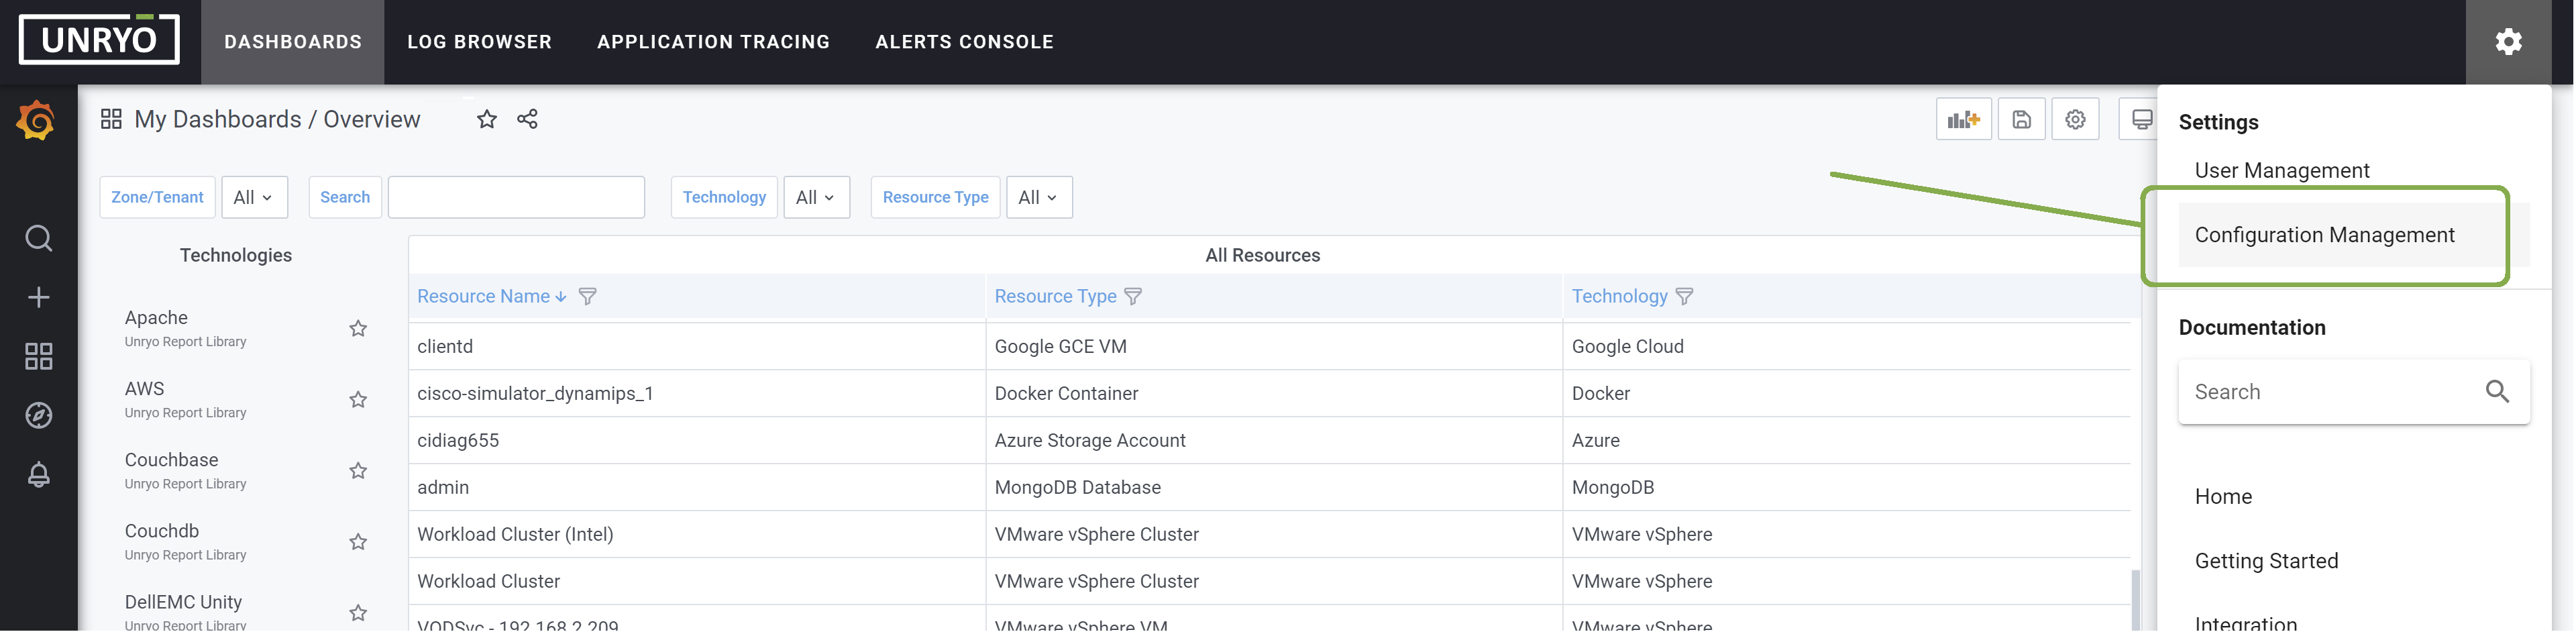
Configuration#
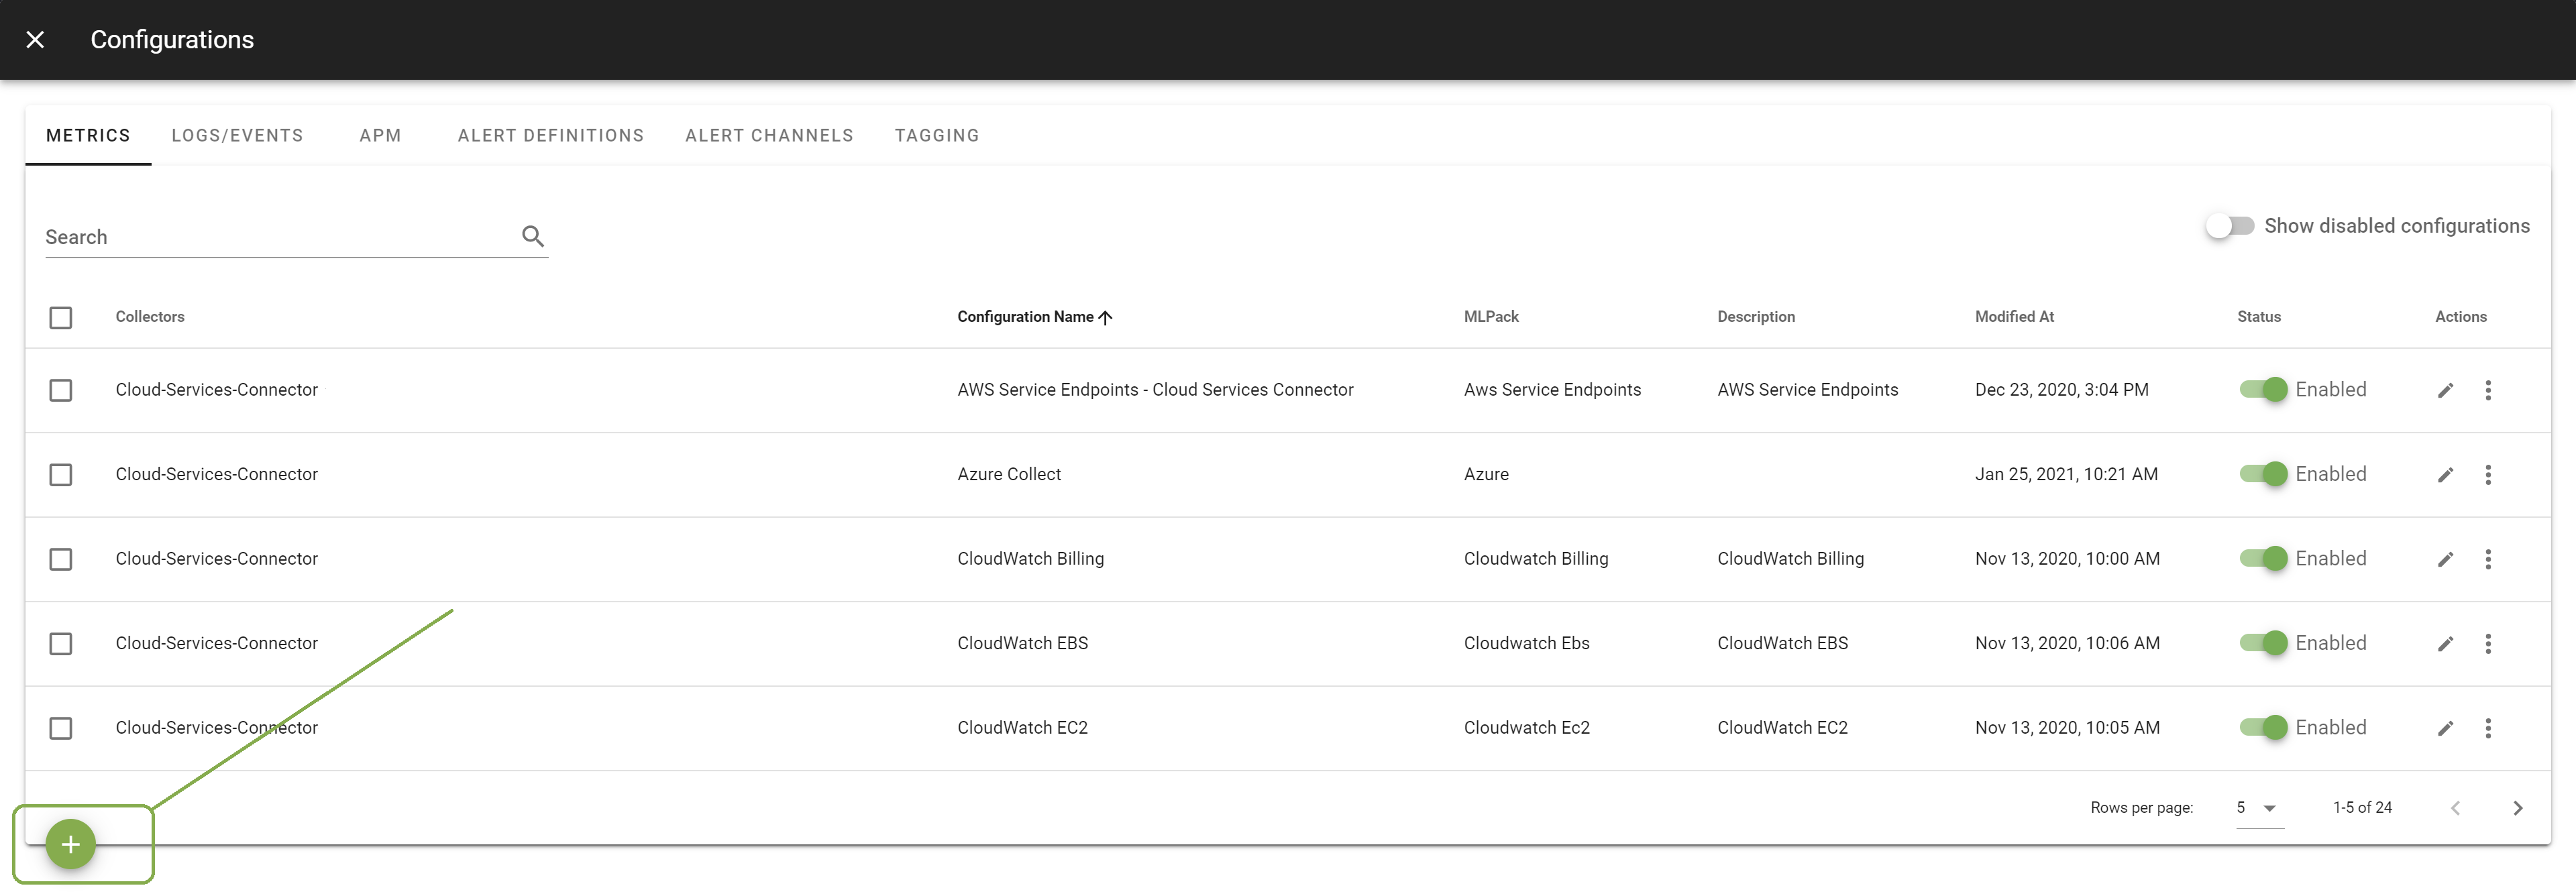
Go in Configuration Management.
Click on the + button to add a new configuration.
Select the template you want to use.
There's a specific configuration file for each AWS service. Example for EC2:
Cloudwatch Ec2.
Select the Collector on which you want this configuration to be deployed; and provide a Configuration Name that is meaningful for you. The Description is optional.
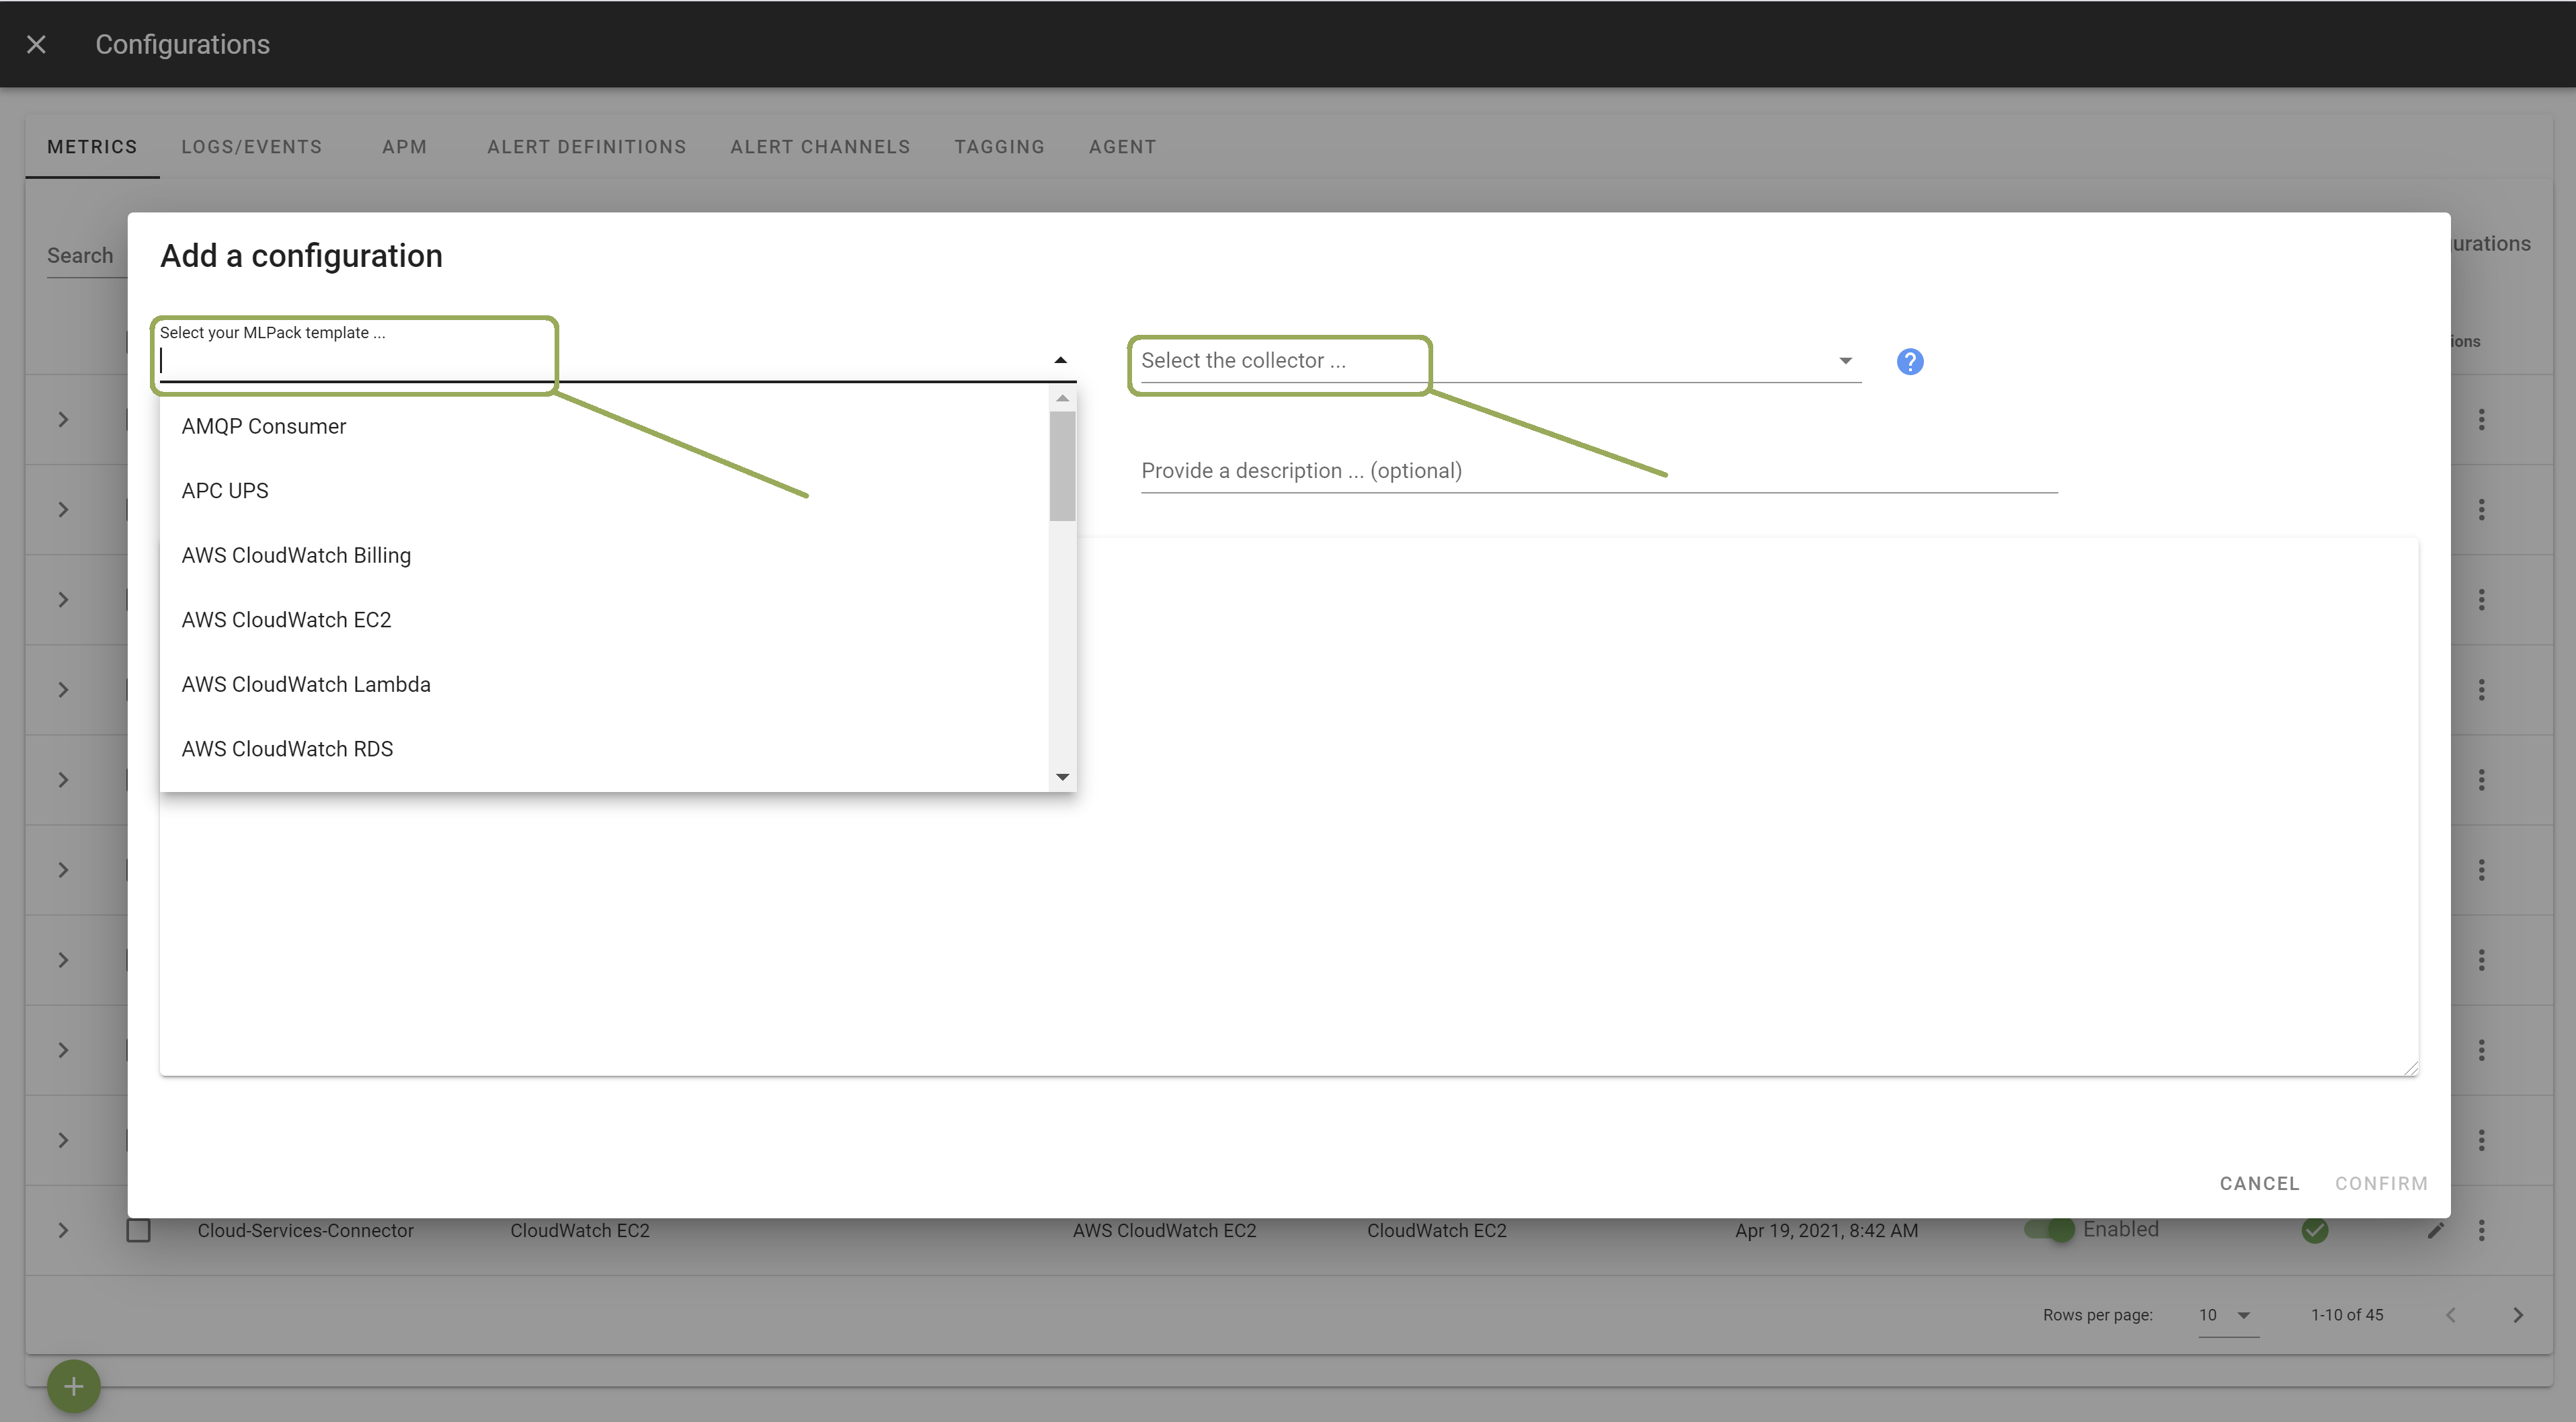
Enter the credentials for your AWS account and the region you want to poll. Other configuration options are possible. Browse the template to discover them.
Once done, click Apply to start the monitoring.
Congratulations! You should now see data in the AWS dashboard.
Optional: customize data collection#
All metrics published by CloudWatch can be retrieved, including custom AWS metrics. To limit cost, you can adjust the polling request rate, and use whitelist/blacklist to filter out metrics.
Monitoring AWS Endpoints Services#
In complement to the CloudWatch API integration, the collector can be configured to execute synthetic HTTP transactions from your data-center to track the end-to-end response time to the AWS Service Endpoints.
To activate synthetic HTTP transactions:
Select the template AWS Service Endpoints. Select the Collector on which you want this configuration to be deployed; and provide a Configuration Name that is meaningful for you. The Description is optional.
Add the list of AWS service endpoints you want to monitor.
Once done, click Apply to start the monitoring.
Congratulations! You should now see data in the AWS Service Endpoints dashboard.